
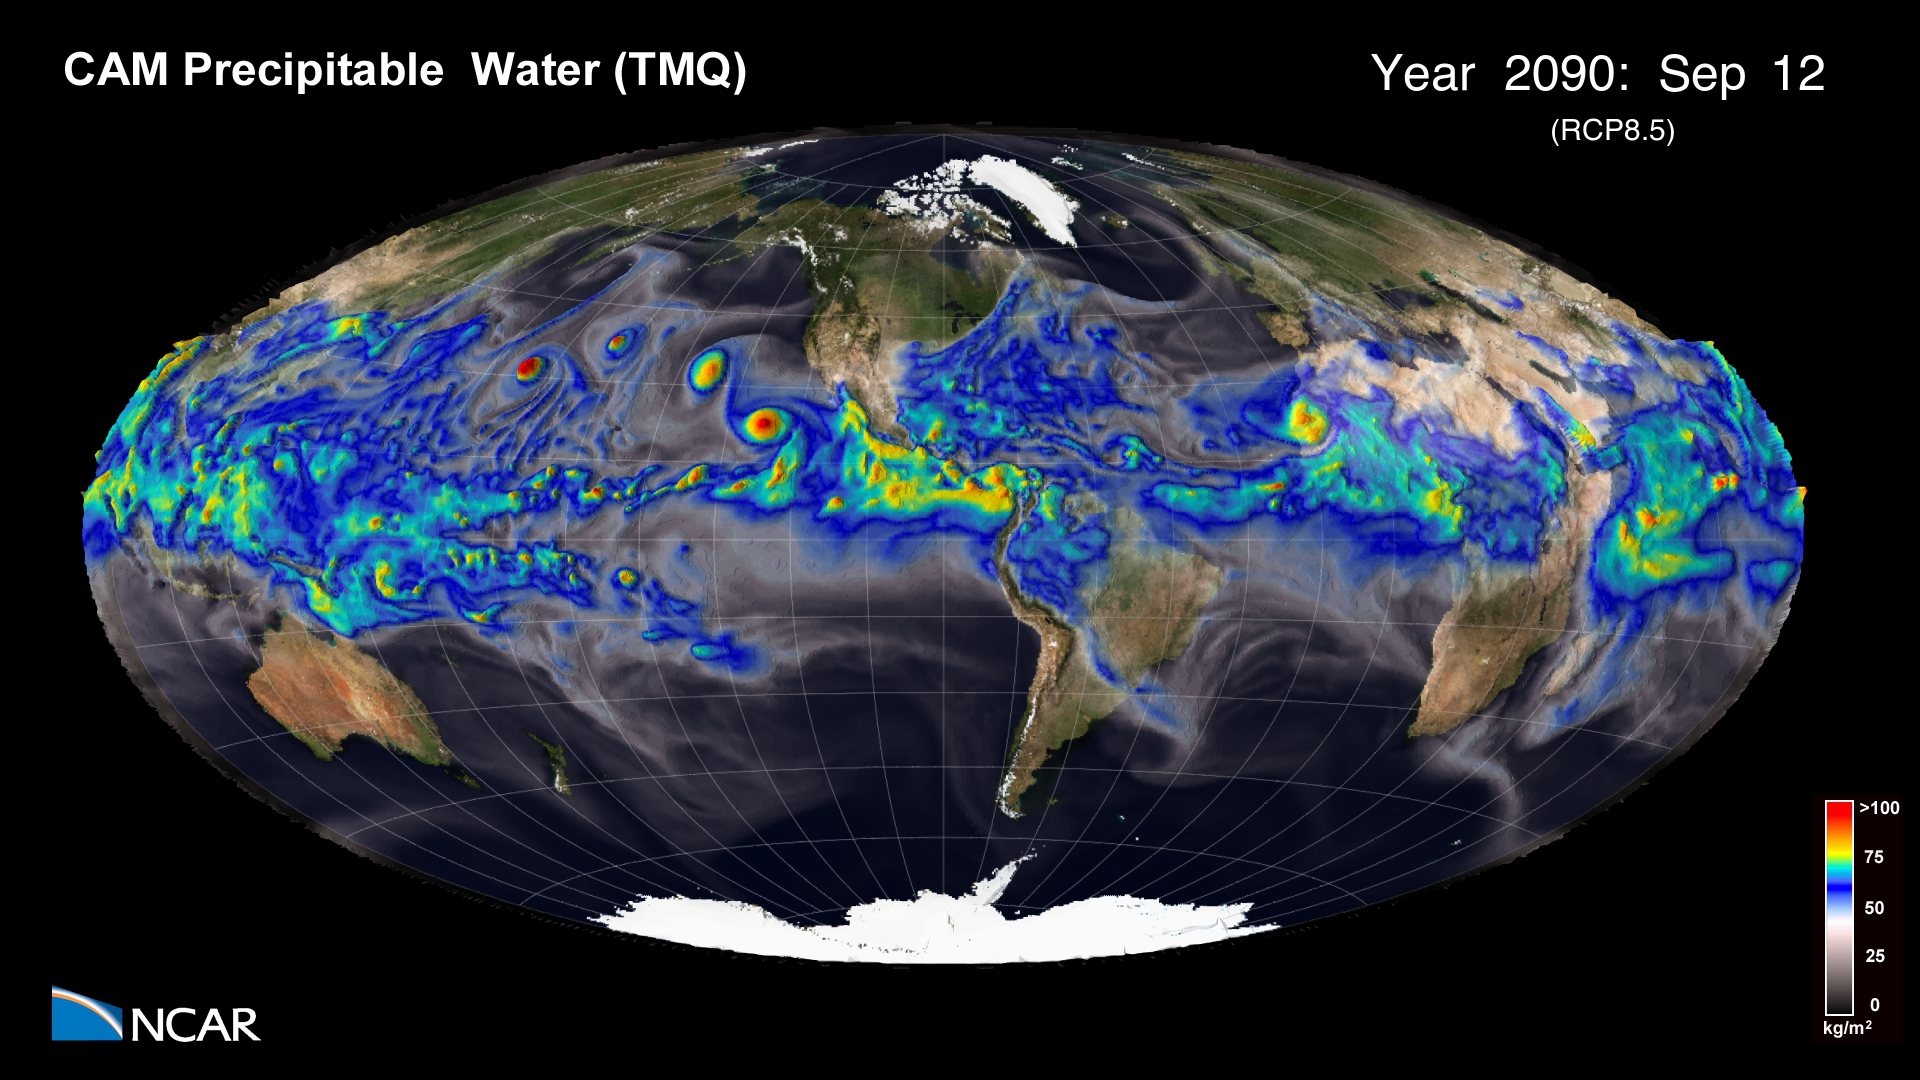
This simulation shows a comparison between present day (1990) and future (2090) precipitable water in the Earth’s atmosphere using an RCP8.5 emissions scenario. Movies Movie File (.mov, 1920×1080, 236MB) Images Science Credits This simulation was made possible because of the large number of individuals both from within NCAR and the many outside collaborators who have…
Read moreCategory: Maya
Climate Change: Temperature Anomalies
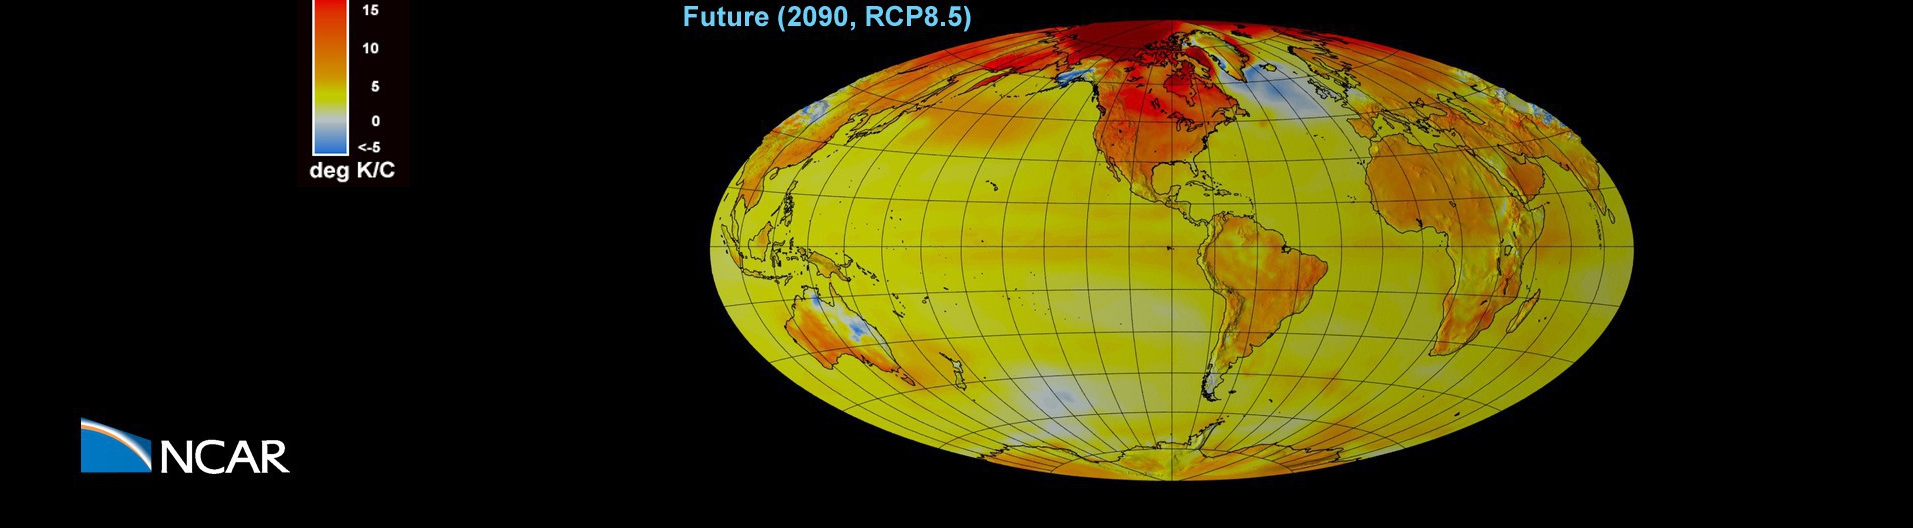
A comparison between present and future (RCP8.5) surface temperature anomalies. A 3-day smoothing has been applied to the output to dampen day to day variability. Movies Movie File (.mov, 118MB, 1920×1080) Images Computational Modeling Nan Rosenbloom and Gary Strand (NCAR/CGD) Visualization and Post-production Tim Scheitlin and Matt Rehme (NCAR/CISL) Model CESM Visualization Software NCAR Command…
Read moreNegative NAO Triggered by Stratospheric Sudden Warming
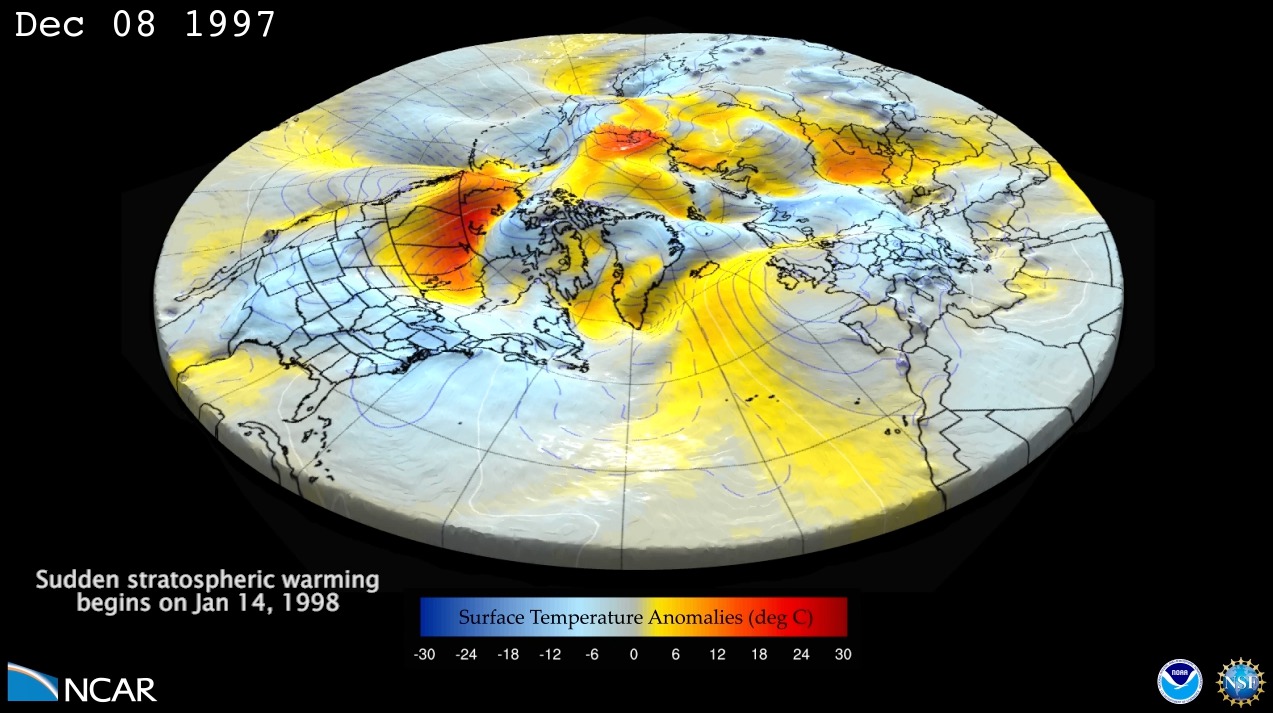
Seasonal forecast for winter of 1997/1998 with 46LCAM (Ensemble member with a sudden stratospheric warming). This is a 4 month forecast of surface geopotential height anomalies (shown with surface relief and contour lines) and surface temperature anomalies (shown with a color gradient). The forecast starts on Dec 1, 1997, and goes through the end of…
Read moreOcean impact on atmospheric oxygen and carbon dioxide
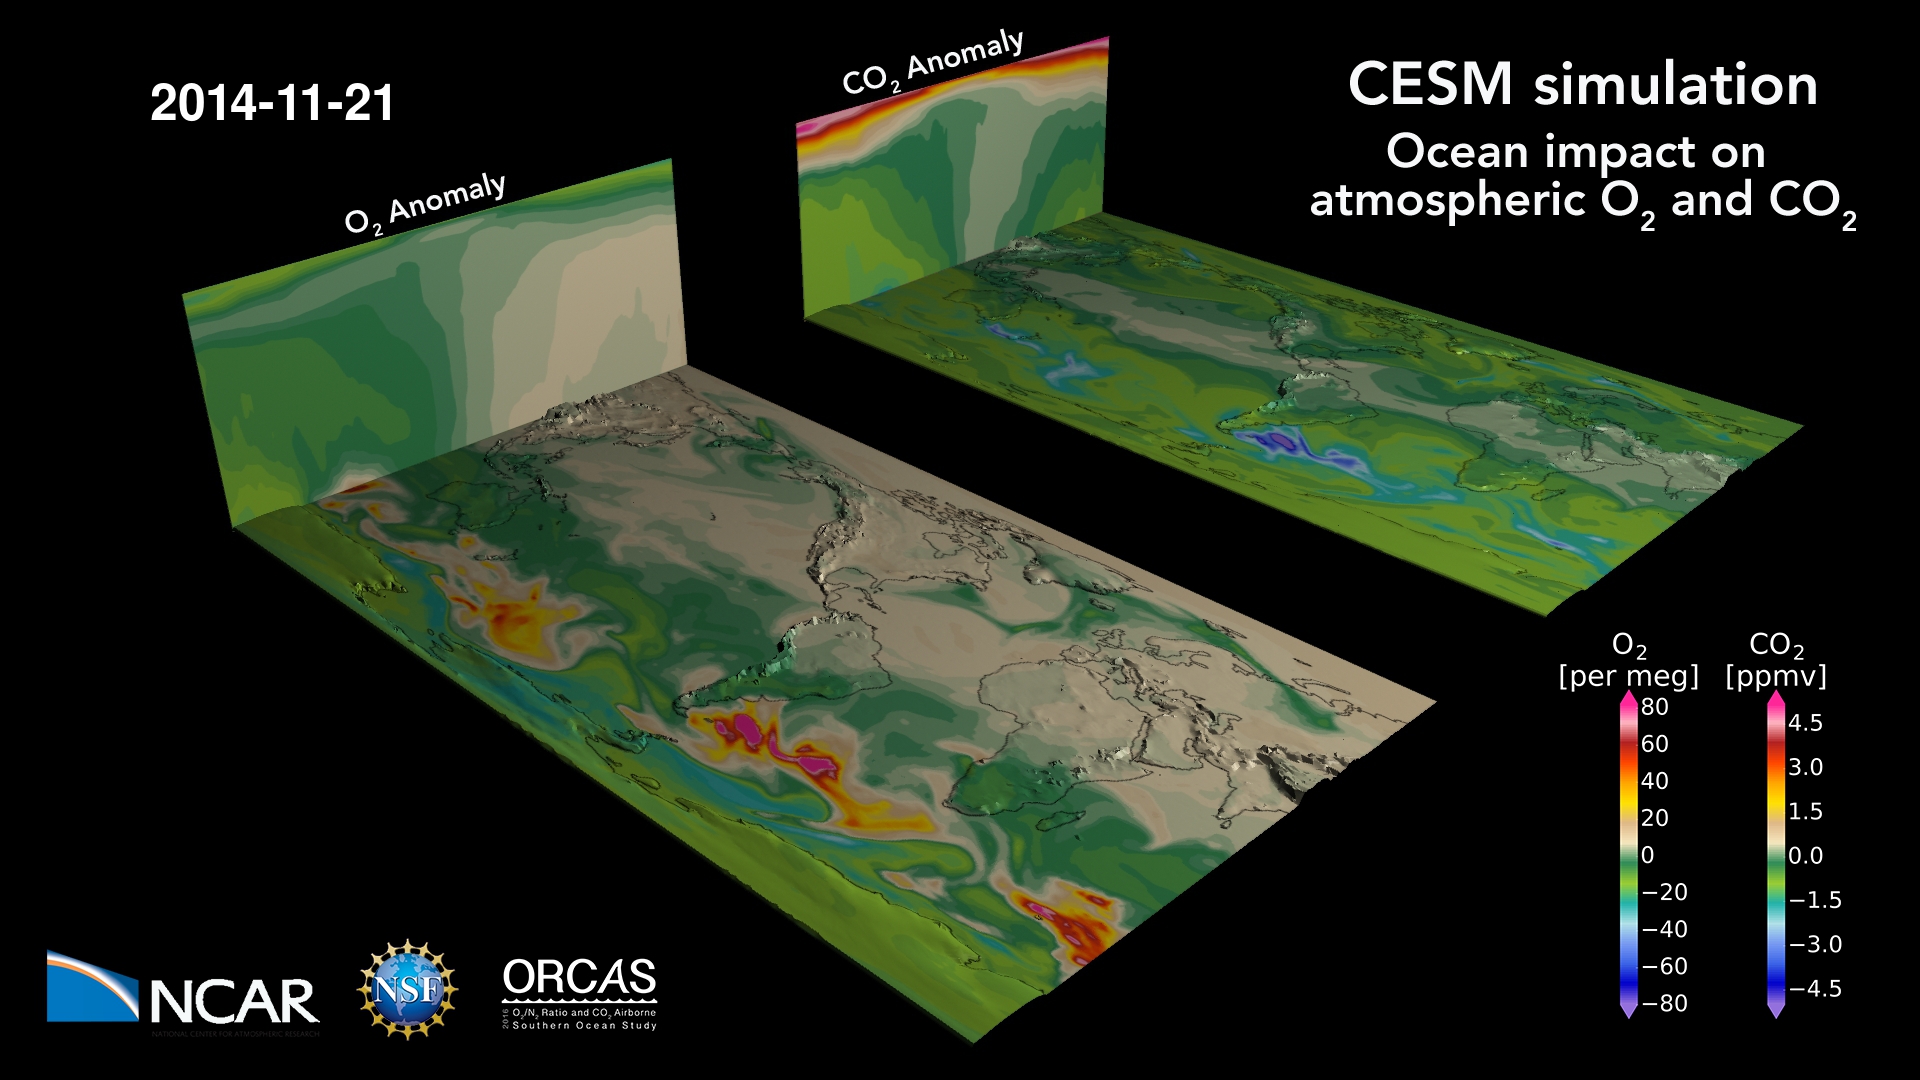
The ocean breathes: a map of oxygen and carbon dioxide variations in the atmosphere due to air-sea gas exchange, stirred by winds. The ocean absorbs CO2 and releases O2 in the summer hemisphere, primarily due to photosynthesis (and warming, for O2) at the surface; the reverse happens during winter when the surface cools and deep…
Read moreSurface Ozone Concentrations on the Colorado Front Range
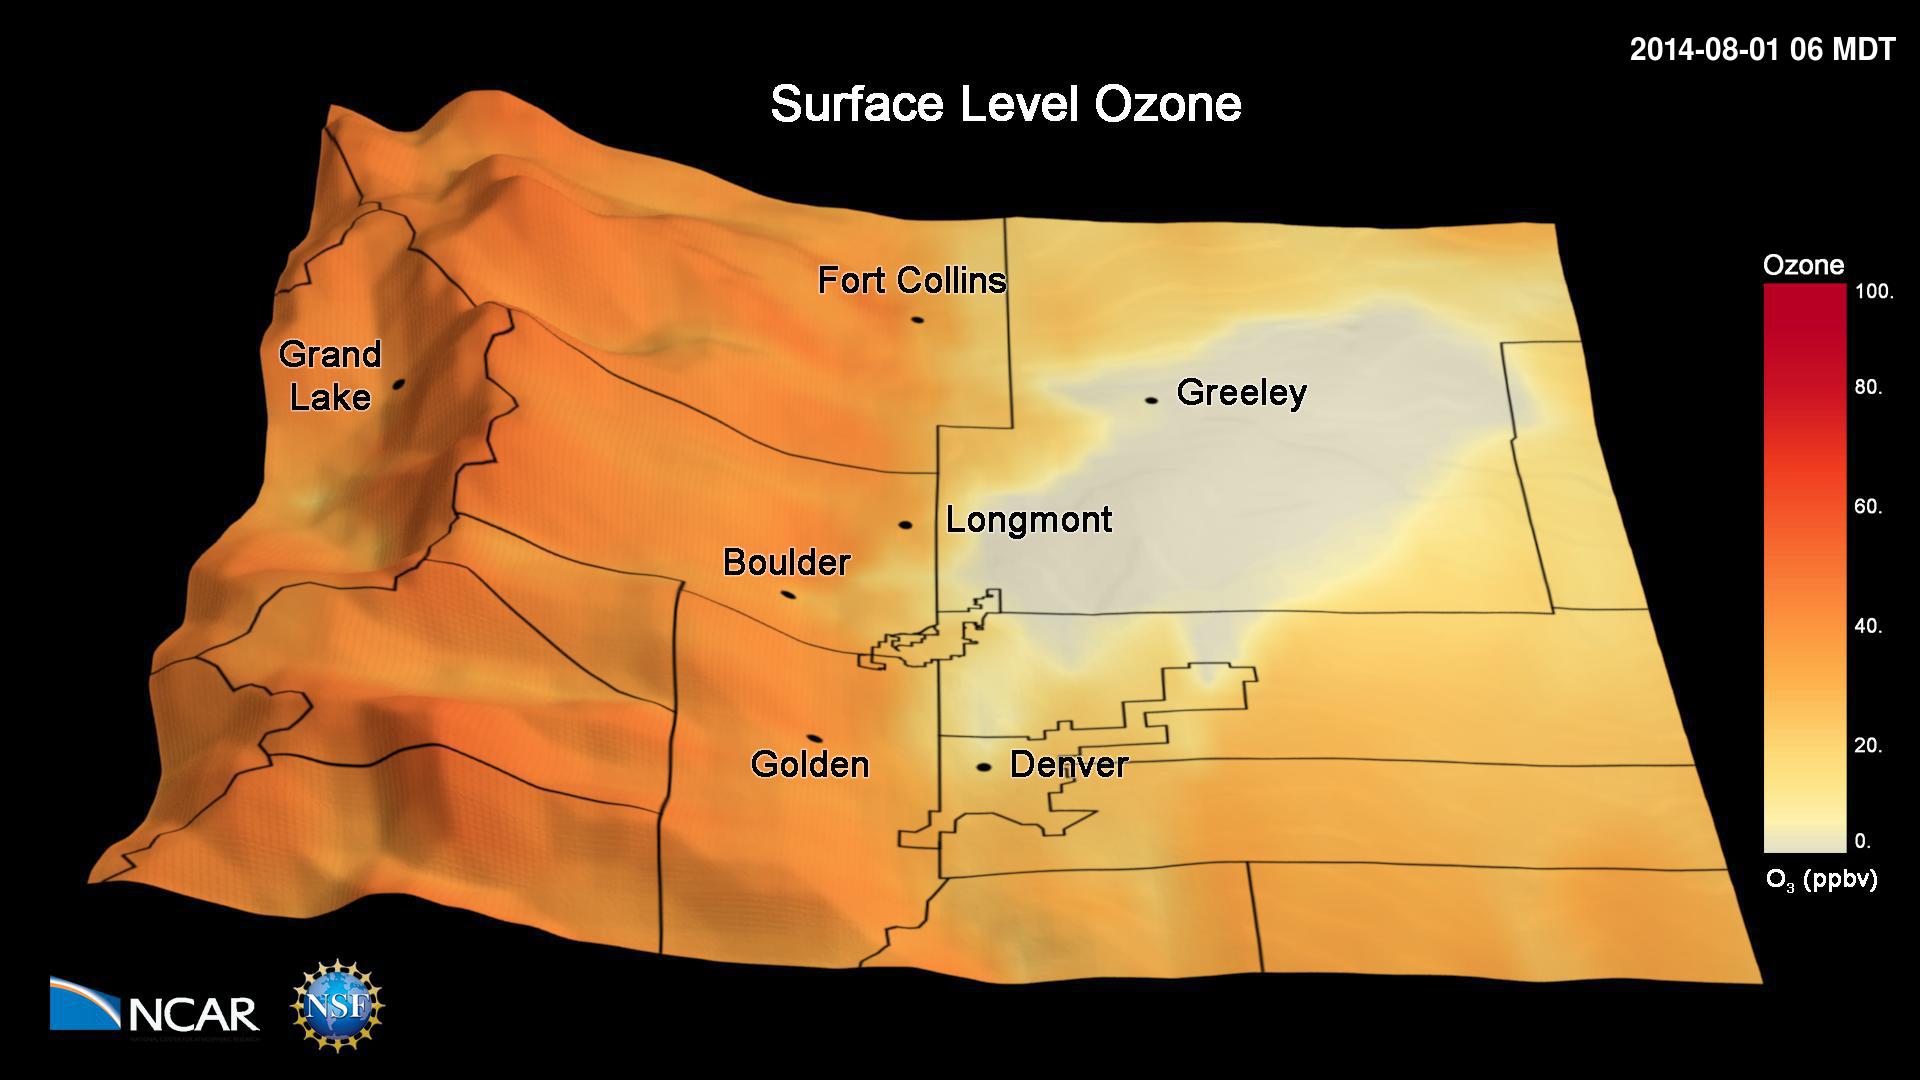
This animation shows simulated hourly surface ozone concentrations during the 2014 FRAPPÉ campaign. The simulations have been performed with the Weather Research and Forecasting (WRF) Community Multiscale Air Quality (CMAQ) model. The simulations have been conducted with a 4 km x 4 km grid horizontal resolution and show the frequent occurrence of high ozone pollution…
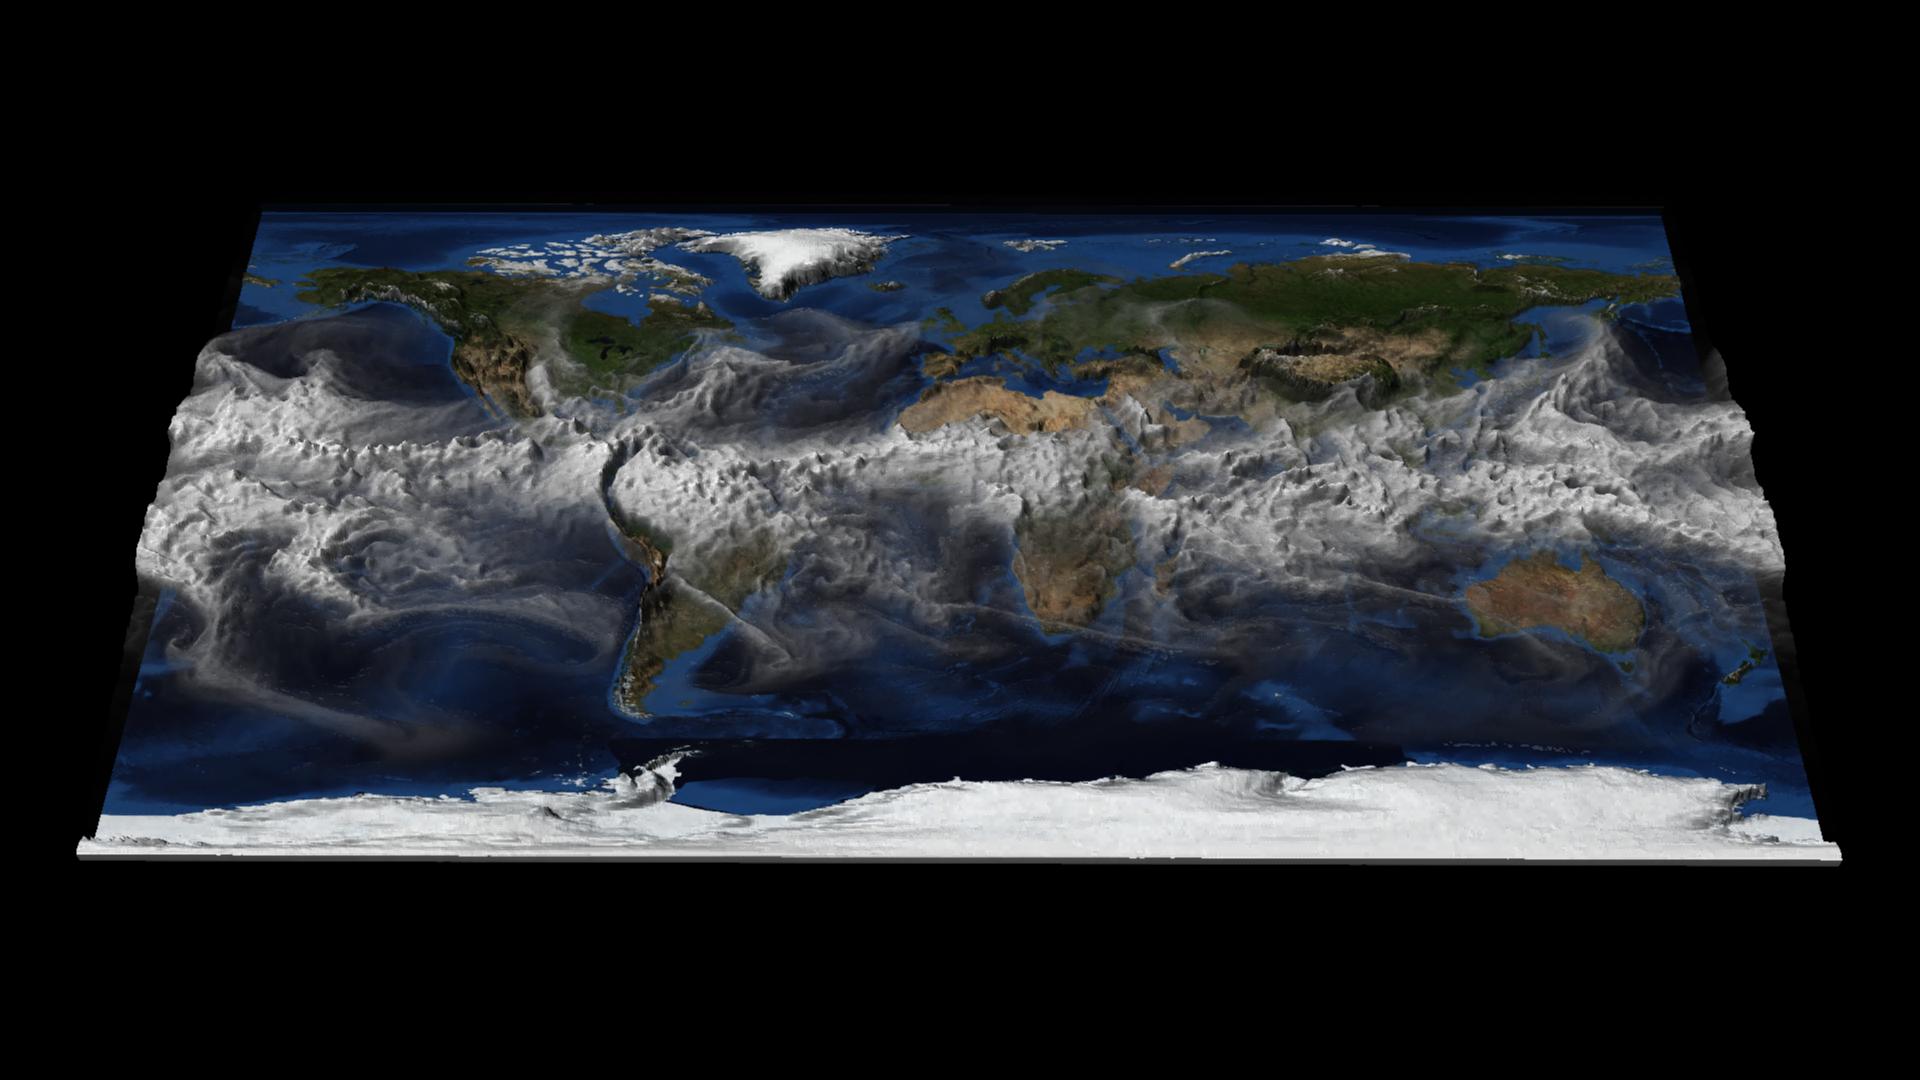
Read moreTotal Accumulation of Global Precipitation
Project Metis: Seasonal Forecasts with Enhanced Ocean and Atmosphere Resolution This visualization shows total accumulation of global precipitation (blue/purple) and the 6-hourly precipitation (yellow/red) between May 1 and Nov 1, 2015. What to look for: Of particular interest are the cyclones that scrawl lines across the map, leaving a visible trail in the total precipitation field. Movies Movie…
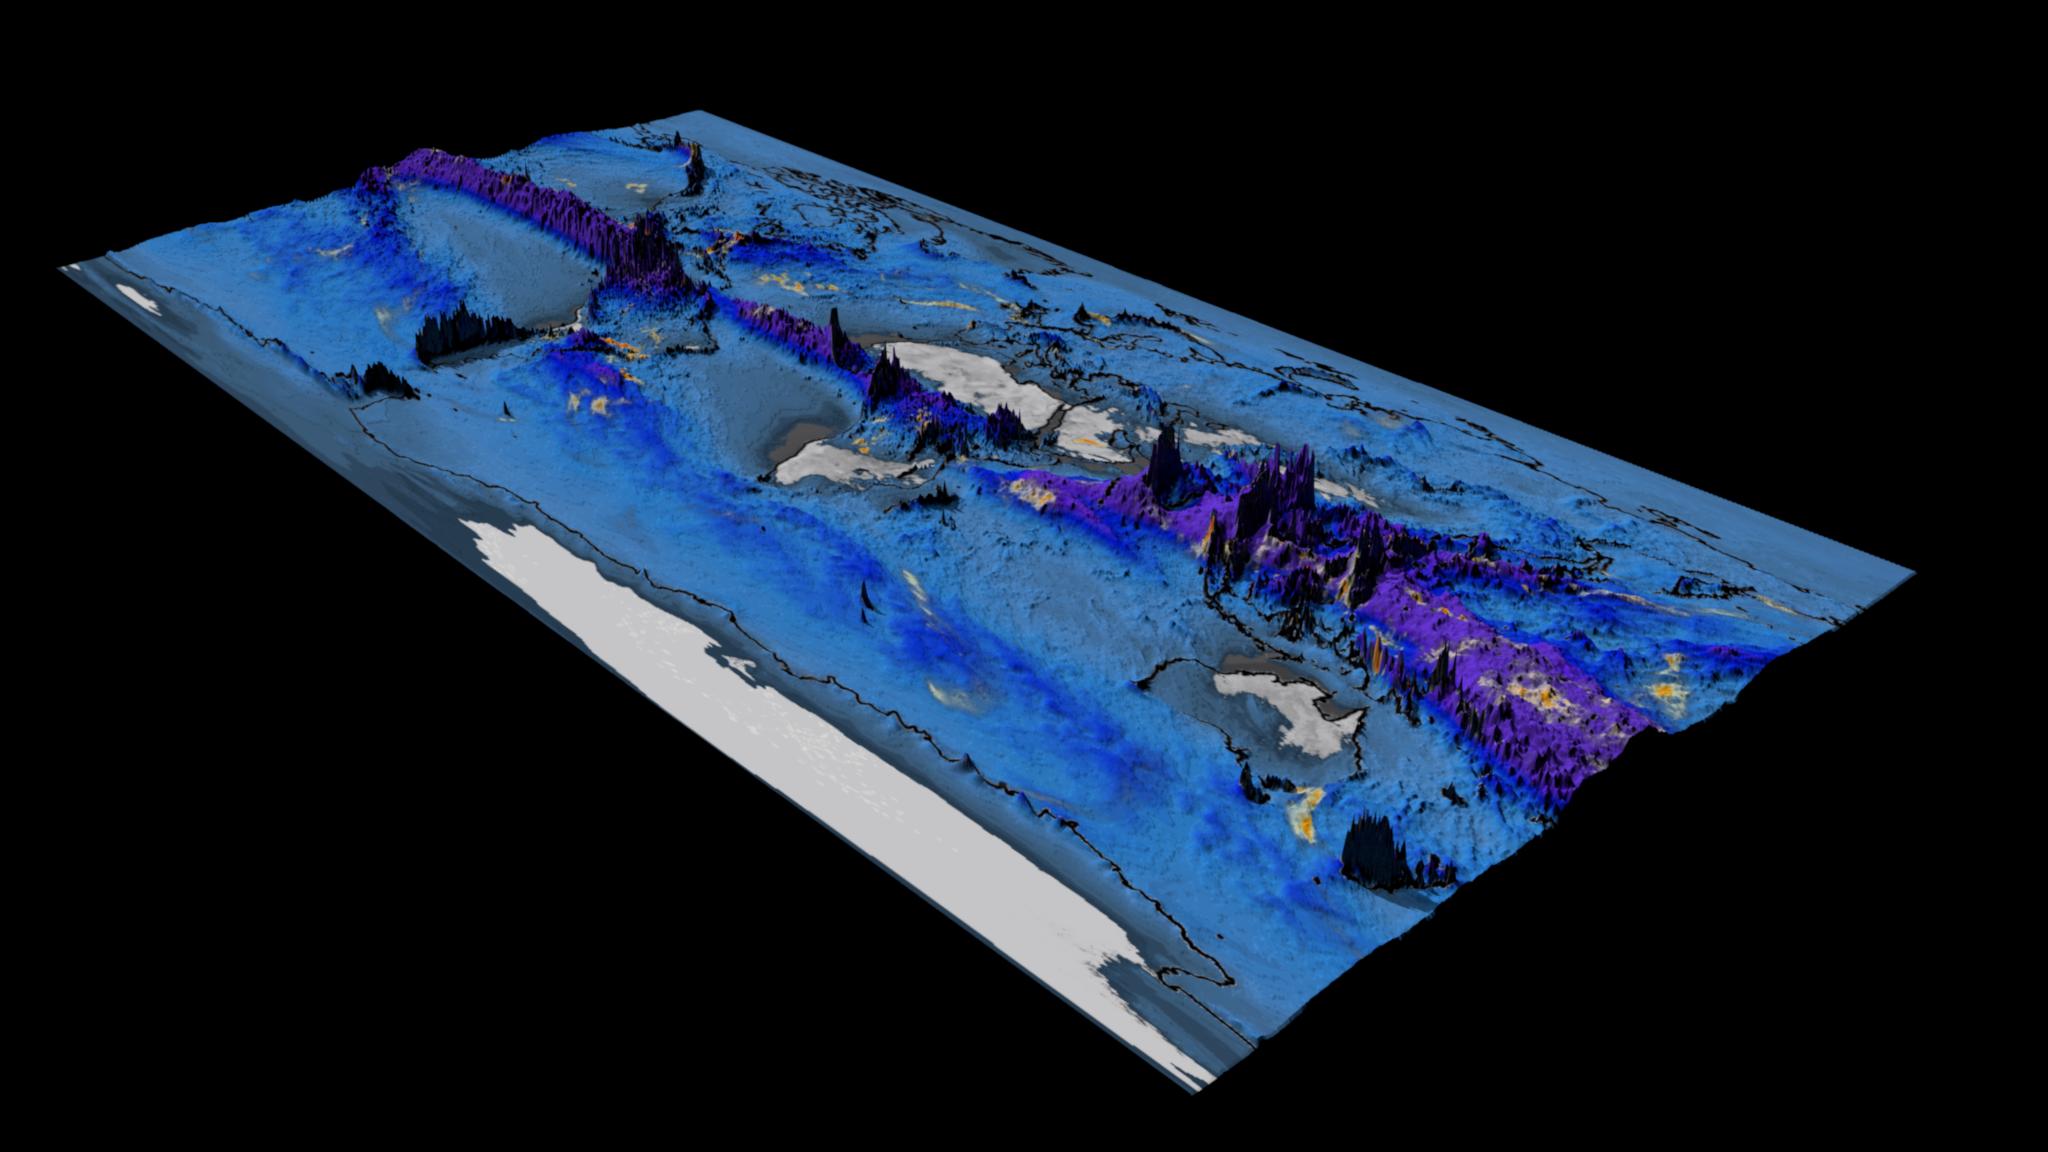
Read morePlanetary Water Vapor
This visualization shows hourly time steps of CESM1 total column integrated water vapor (TMQ) for one year. The value of TMQ at each point determines the amount of 3D surface displacement. Higher values of TMQ have a larger displacement, helping to visually identify regions with the most significant temporal changes in water vapor. Movies Quicktime…
Read moreChino Hills Earthquake
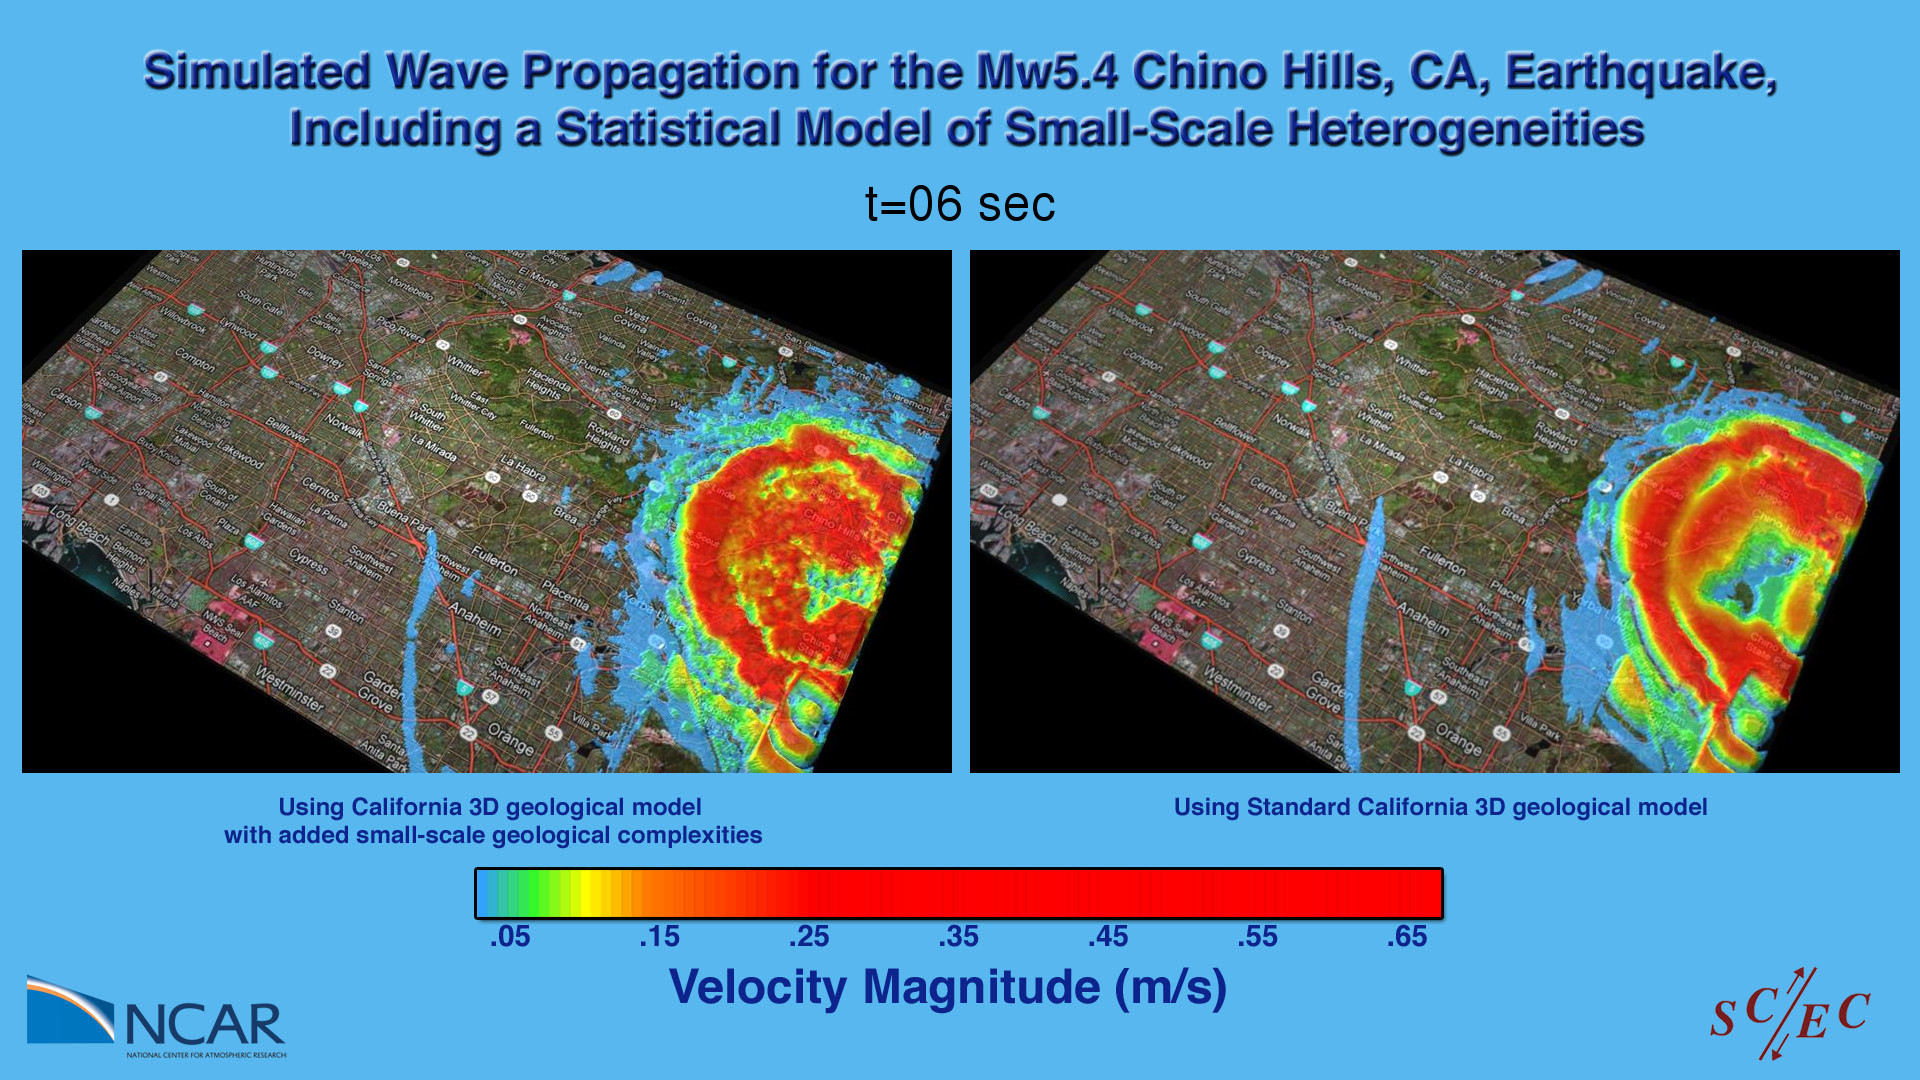
Southern California Earthquake Center (SCEC) researchers are working to improve ground motion simulations for California by developing more realistic small-scale models of the earth’s near-surface structure. The two animations shown in this visualization compare simulation results showing peak ground velocities at the earth’s surface for the M5.4 Chino Hills California earthquake. For the two simulations…
Read more