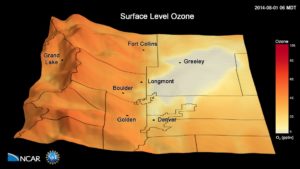
This animation shows simulated hourly surface ozone concentrations during the 2014 FRAPPÉ campaign. The simulations have been performed with the Weather Research and Forecasting (WRF) Community Multiscale Air Quality (CMAQ) model.
The simulations have been conducted with a 4 km x 4 km grid horizontal resolution and show the frequent occurrence of high ozone pollution in the Colorado Front Range and the transport of this pollution into the nearby mountains during upslope events.
The model represents well observations made on the ground and from aircraft during the 2014 FRAPPÉ campaign (https://www2.acom.ucar.edu/frappe).
Movies
Movie File (.mp4, 255MB, 1920×1080, 3m 19s)
Images

Further Information
NCAR/ACOM Report prepared for the Colorado Department of Public Health and Environment: (https://www.colorado.gov/airquality/t…)
Data and Science Credits
Gabriele Pfister and Frank Flocke, NCAR/ACOM; NCAR/NSF and State of Colorado FRAPPÉ (https://www2.acom.ucar.edu/frappe) and NASA DISCOVER-AQ Colorado (https://www-air.larc.nasa.gov/mission…) field experiments.
Computational Resources
This research used compute and storage resources from the NCAR Computational and Information Systems Laboratory including Yellowstone, a 1.5-petaflops, high-performance IBM iDataPlex cluster, and Glade, a centralized high-performance GPFS shared file system.
Visualization and Post-production
Tim Scheitlin (NCAR/CISL)
Model
The simulations have been performed with the Weather Research and Forecasting (WRF) Community Multiscale Air Quality (CMAQ) model.
Visualization Software
The NCAR Command Language (Version 6.4.0) [Software]. (2017). Boulder, Colorado: UCAR/NCAR/CISL/TDD. http://dx.doi.org/10.5065/D6WD3XH5
Acknowledgments
Sponsored by the National Science Foundation and the Colorado Department of Public Health and Environment.
