Project Metis: Seasonal Forecasts with Enhanced Ocean and Atmosphere Resolution
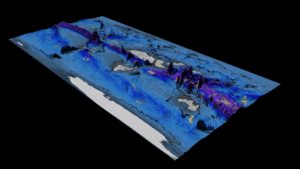
This visualization shows total accumulation of global precipitation (blue/purple) and the 6-hourly precipitation (yellow/red) between May 1 and Nov 1, 2015.
What to look for: Of particular interest are the cyclones that scrawl lines across the map, leaving a visible trail in the total precipitation field.
Movies
Movie File (.mp4, 168MB, 2048×1152)
Images

Science Credits
Computational Resources
This research was enabled by NCAR-CISL compute resources. The simulation was run on Cheyenne, a 5.34-petaflops, SGI ICE XA Cluster featuring 145,152 Intel Xeon processor cores in 4,032 dual-socket nodes and 313 TB of total memory.
Visualization and Post-production
Tim Scheitlin (NCAR/CISL)
Data Source
The data for the visualization was generated as part of Project Metis, a continuation of the highly successful collaboration between the Center for Ocean-Land-Atmosphere Studies (COLA), located at George Mason University, and the European Centre for Medium-Range Weather Forecasts (ECMWF), in support of both centers’ ongoing efforts to understand and quantify predictability in the climate system from daily to interannual time scales.
The Metis project explores the impact of increasing both atmospheric and oceanic resolution on model fidelity and prediction skill in a coupled ocean (waves, currents and sea-ice), land and atmosphere ensemble framework.
Visualization Software
Acknowledgments
This research was enabled by the National Center for Atmospheric Research (NCAR) CISL compute resources. The simulation was run on Cheyenne, a 5.34 petaflops, SGI ICE XA Cluster featuring 145,152 latest-generation Intel Xeon processor cores in 4,032 dual-socket nodes (36 cores/node) and 313 TB of total memory.
