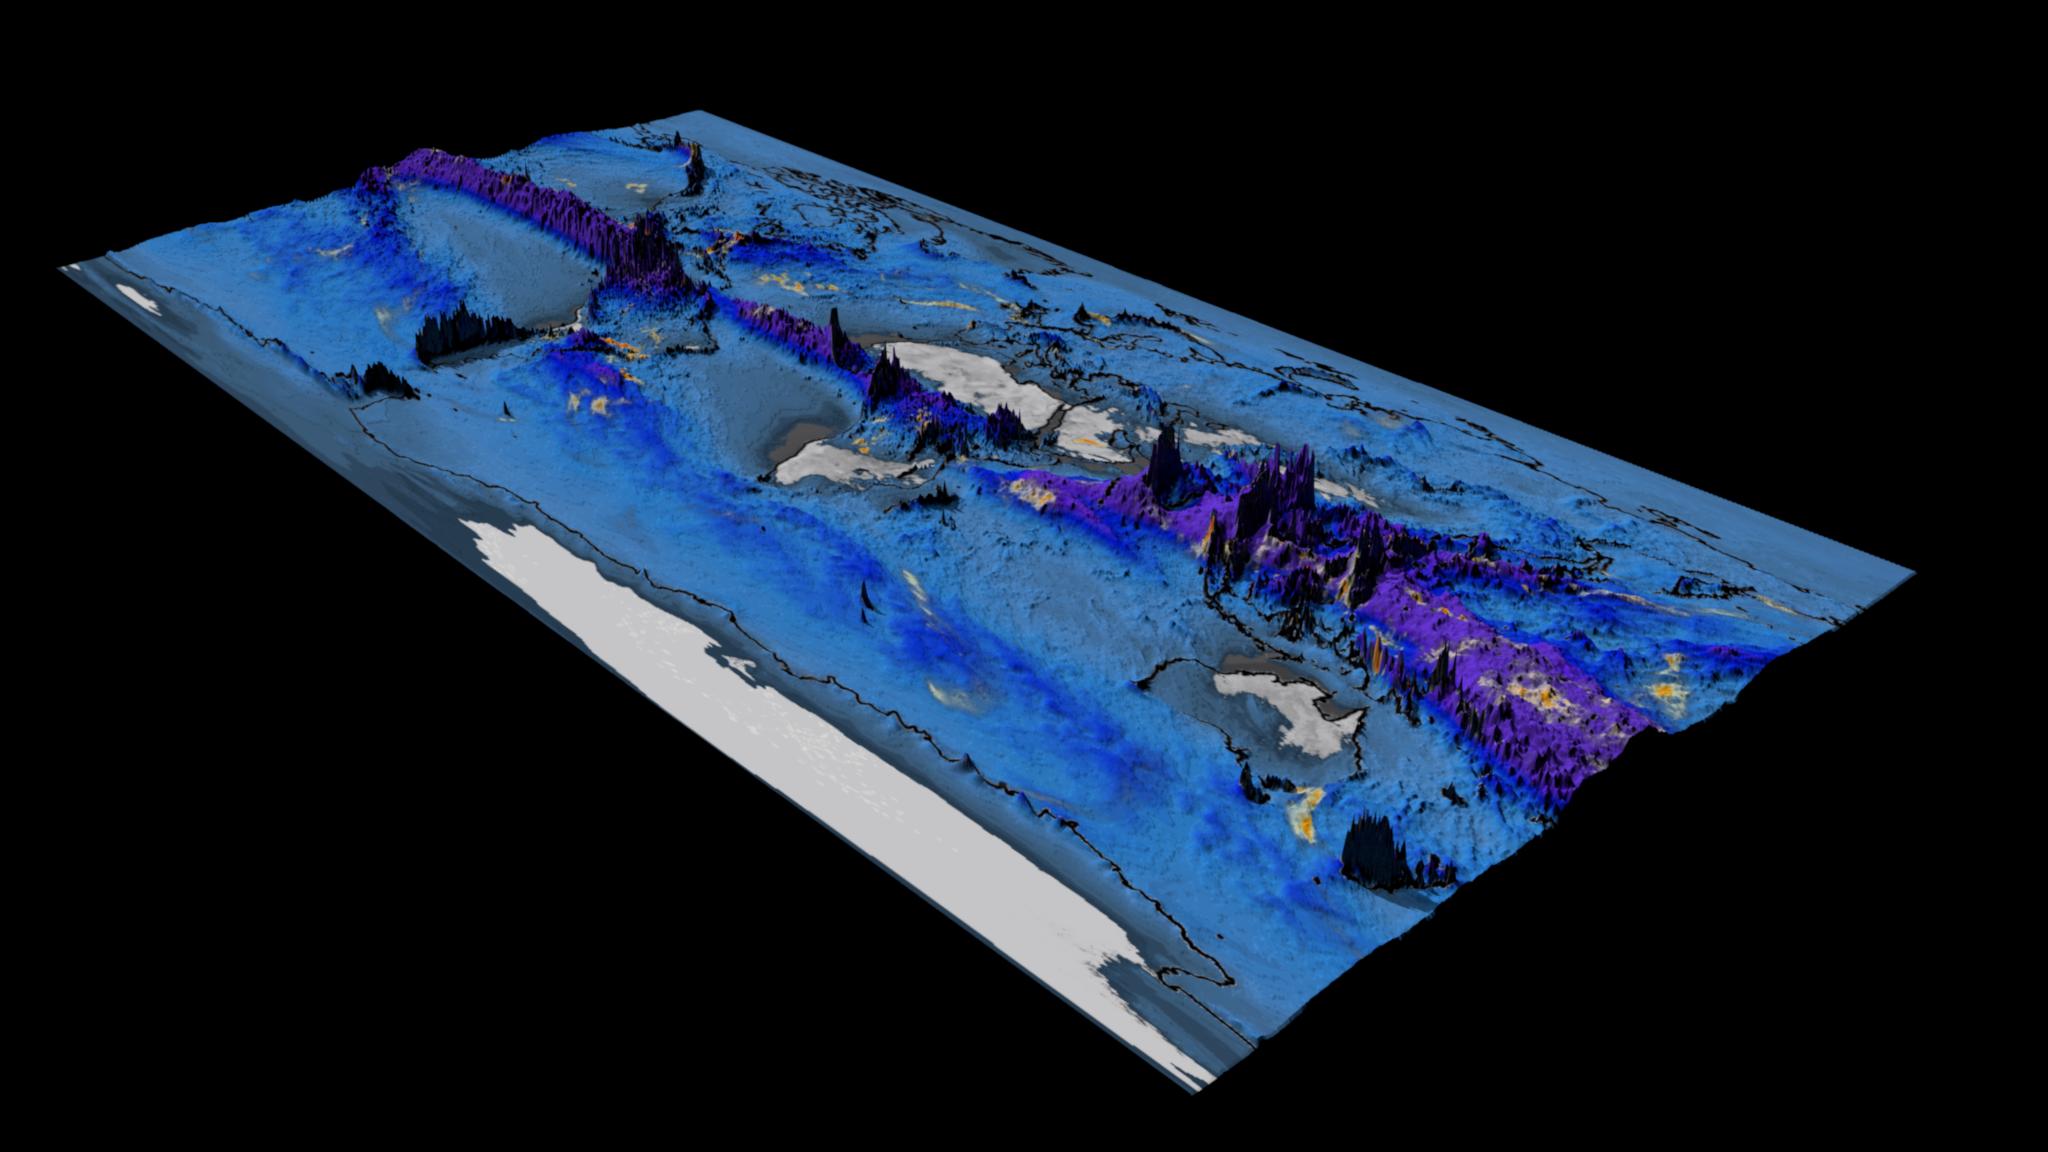
Project Metis: Seasonal Forecasts with Enhanced Ocean and Atmosphere Resolution This visualization shows total accumulation of global precipitation (blue/purple) and the 6-hourly precipitation (yellow/red) between May 1 and Nov 1, 2015. What to look for: Of particular interest are the cyclones that scrawl lines across the map, leaving a visible trail in the total precipitation field. Movies Movie…
Read more