
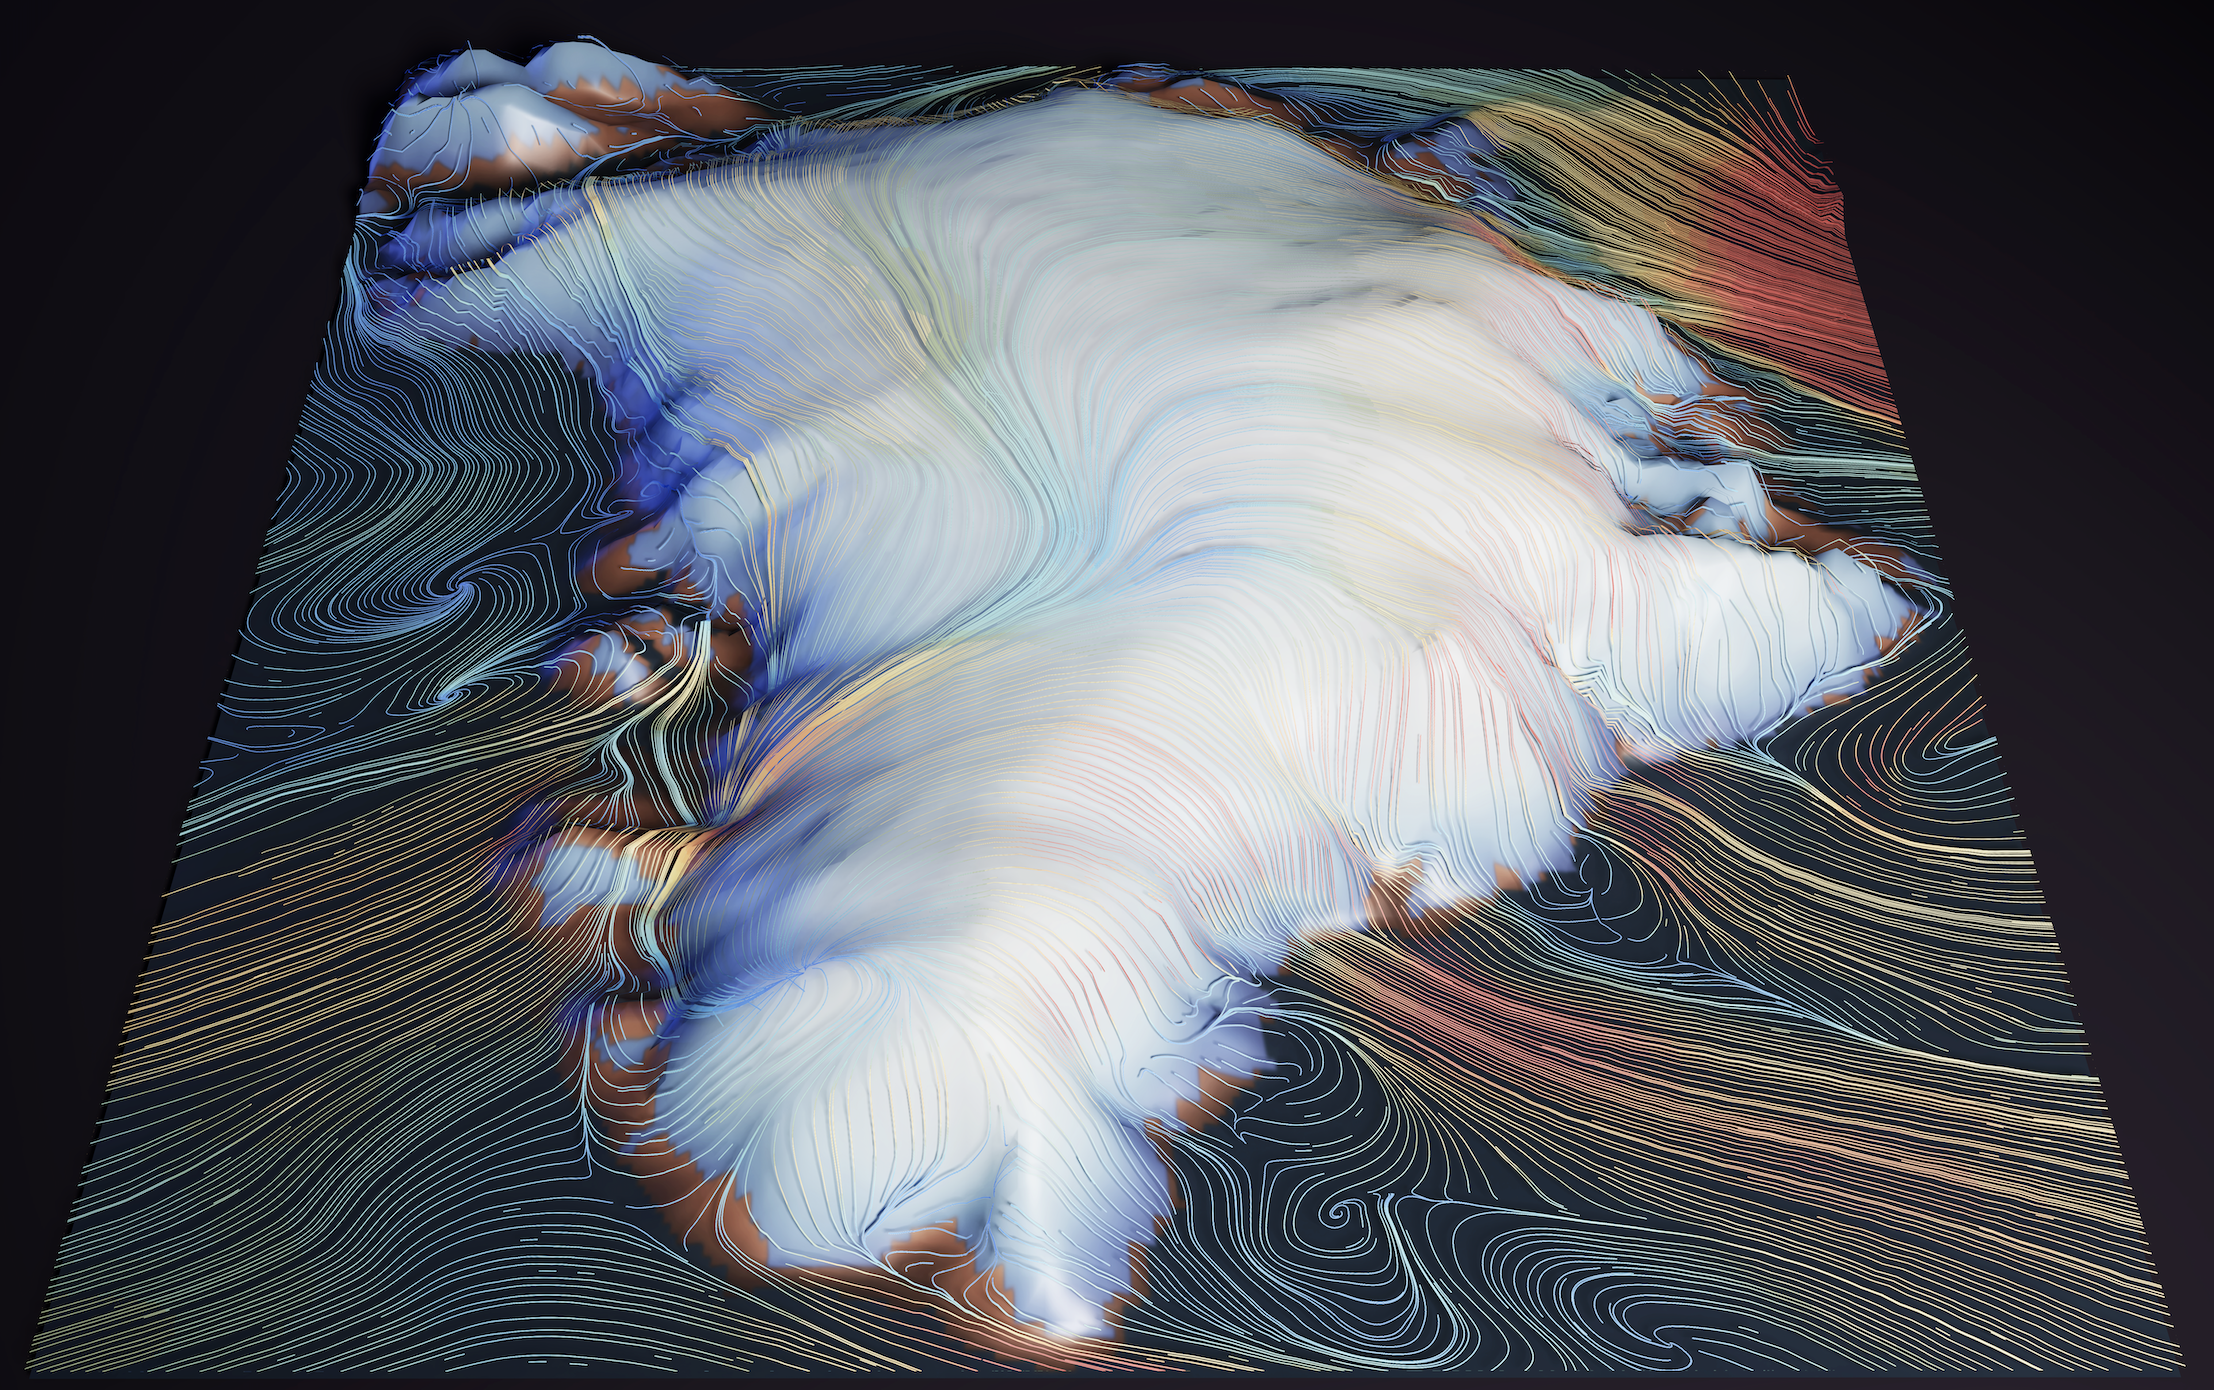
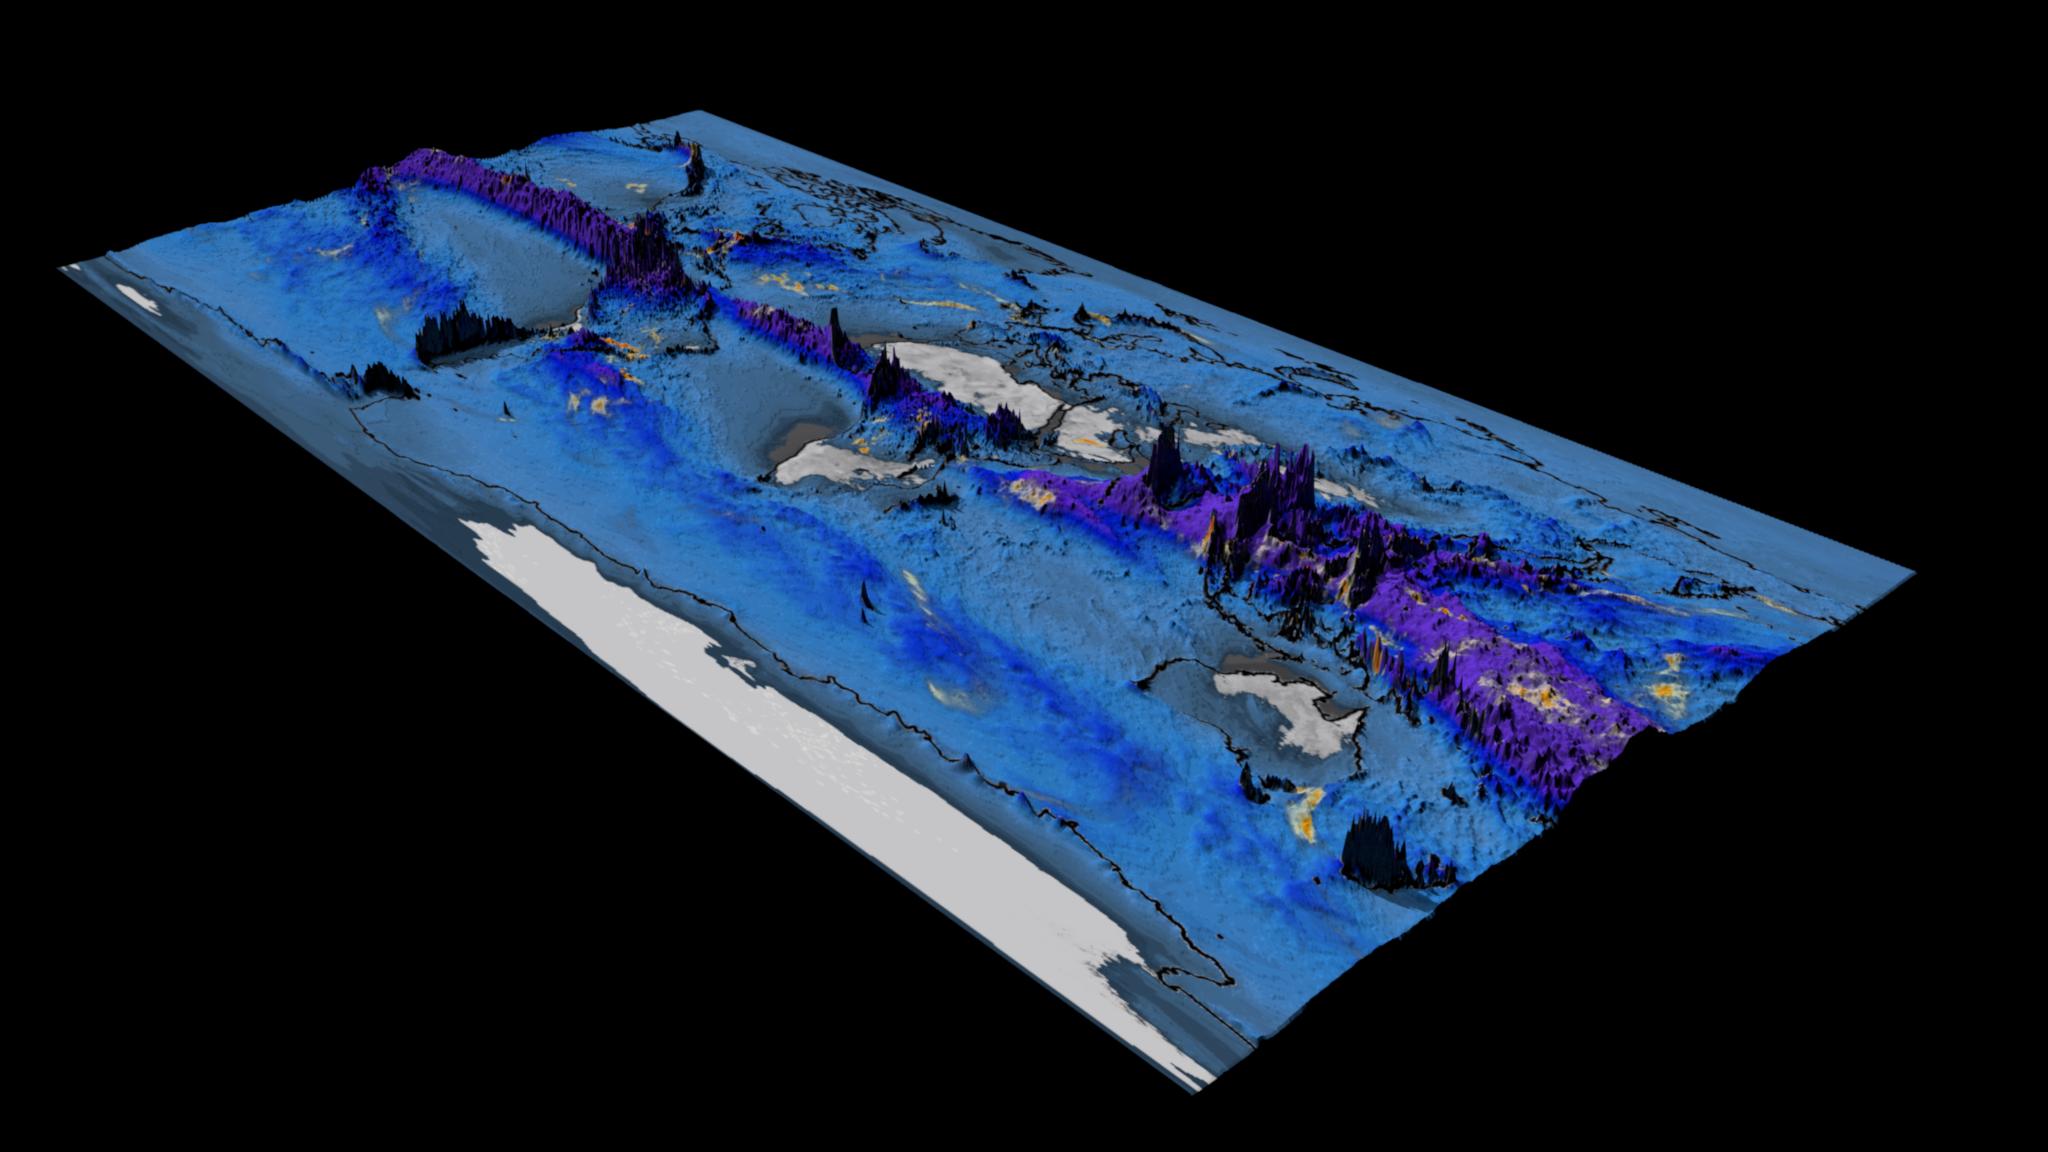
The System for Integrated Modeling of the Atmosphere (SIMA) has rolled out two new variable-resolution configurations with regional refinement over the Arctic and Greenland*. This is a 3D visualization of a simulation using the Greenland grid, which refines the big ice sheet with 1/8˚ grid resolution. The visualization shows that storms traverse the refinement region…
Read moreCategory: Precipitation
CCSM Spring Snow Cover
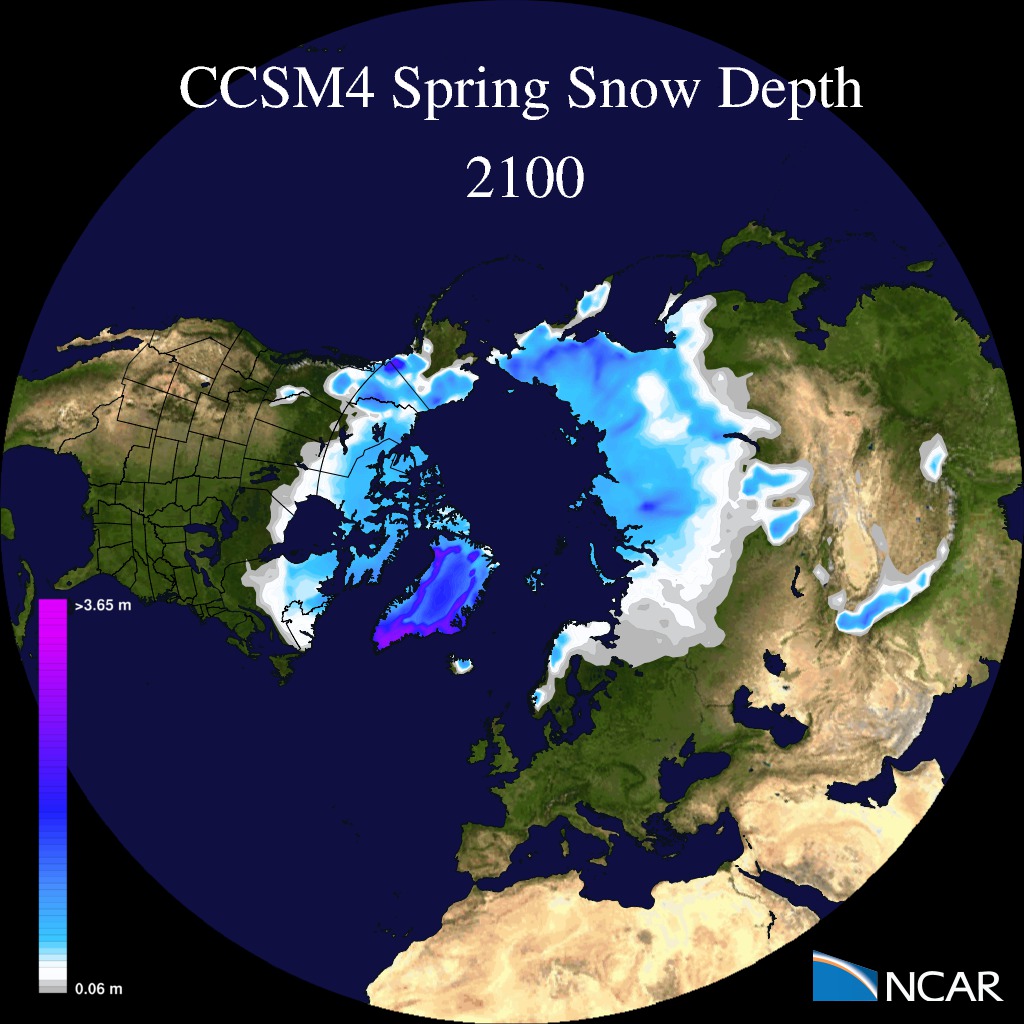
This visualization shows 4-year running means of snow cover over North America from 1853 to 2100. These visualizations were created using the Community Climate System Model (CCSM). Primary sponsors of CCSM are the National Science Foundation and the U.S. Department of Energy, Office of Science. Movies North American Snow Depth Movie file (6MB) Polar Disk…
Read moreCoalescing Droplets in Turbulence
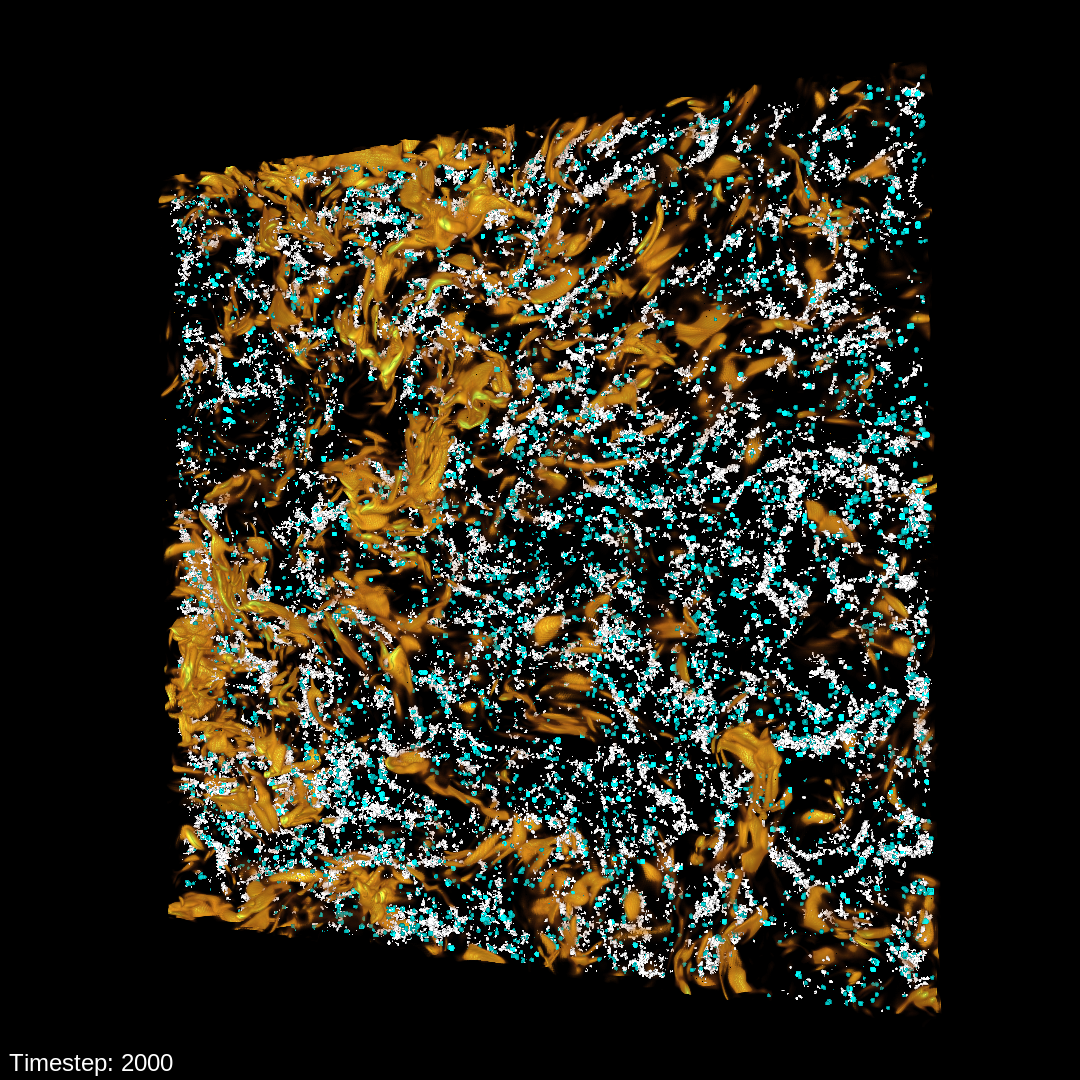
Precipitation in warm clouds can be explained by coalescing water droplets. This coalescence can be accelerated by turbulent vortices within the cloud. In this visualization, we see how this turbulence drives the coalescence of large and small droplets. Movies Movie File (.mp4, 224MB, 1920×1080) Images Science Credits Melanie Li Sing How (Cornell), Lance Collins…
Read morePresent and Future Climate in a Global Model
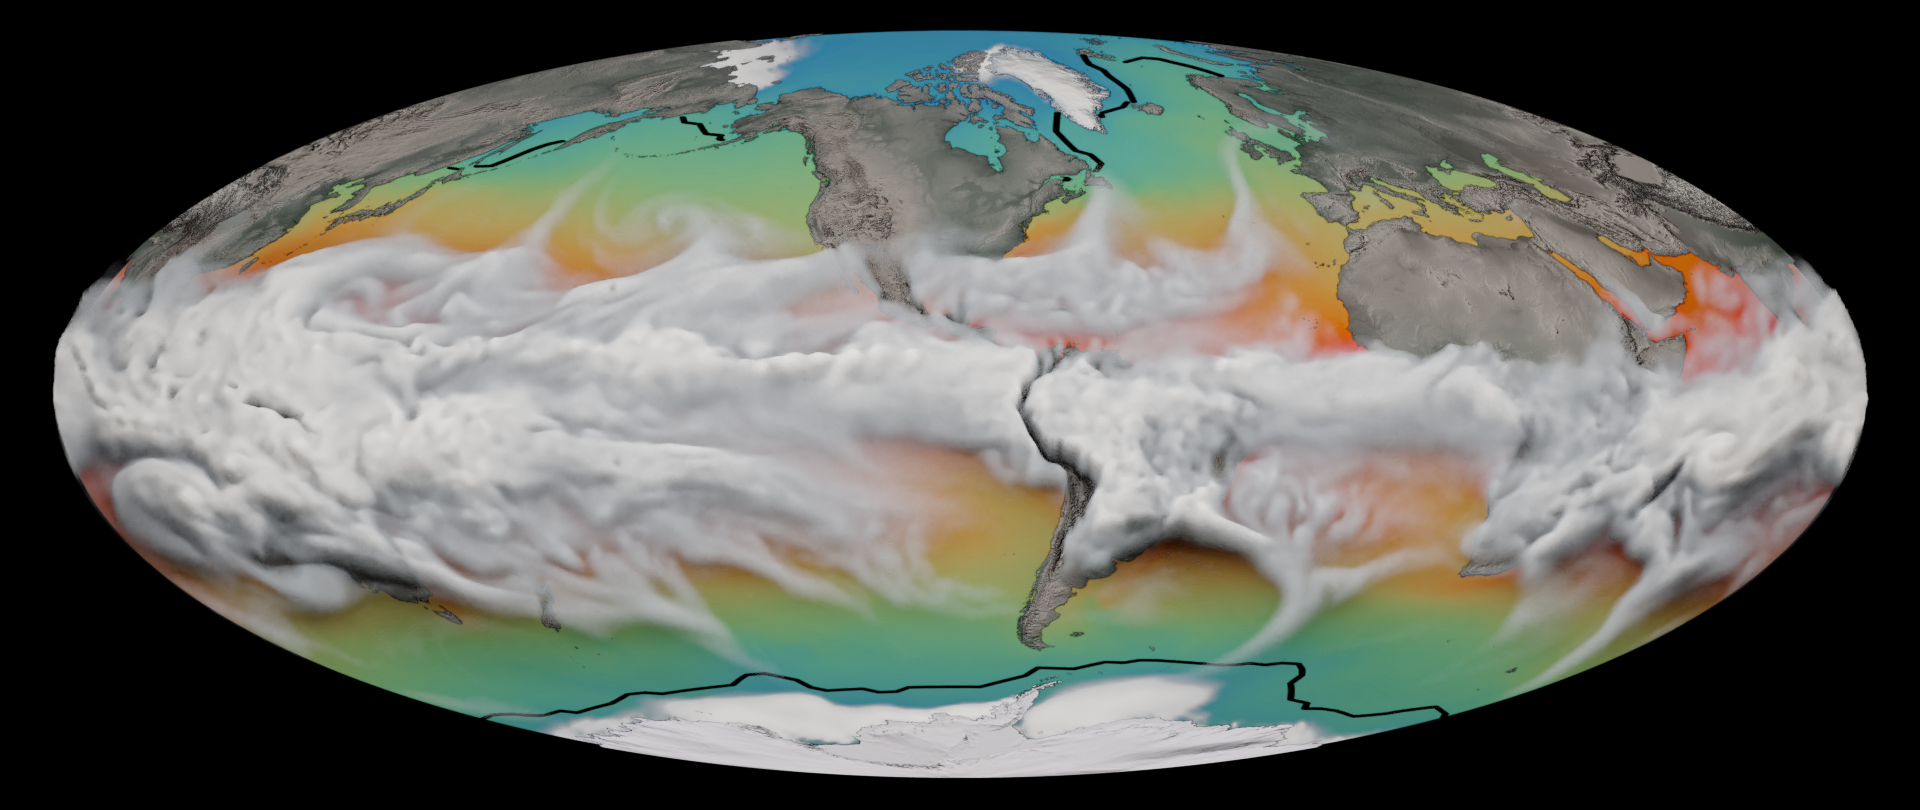
This visualization shows a CESM1 model comparison between a present day (1990) and a future (2090) simulation using a business-as-usual or high emissions scenario, called RCP8.5. Clouds represent six-hourly time steps of total water vapor for one year. Technically speaking, this is the CESM1 model variable, TMQ, defined as the total precipitable water (vertically integrated)…
Read moreClimate Change: Precipitation
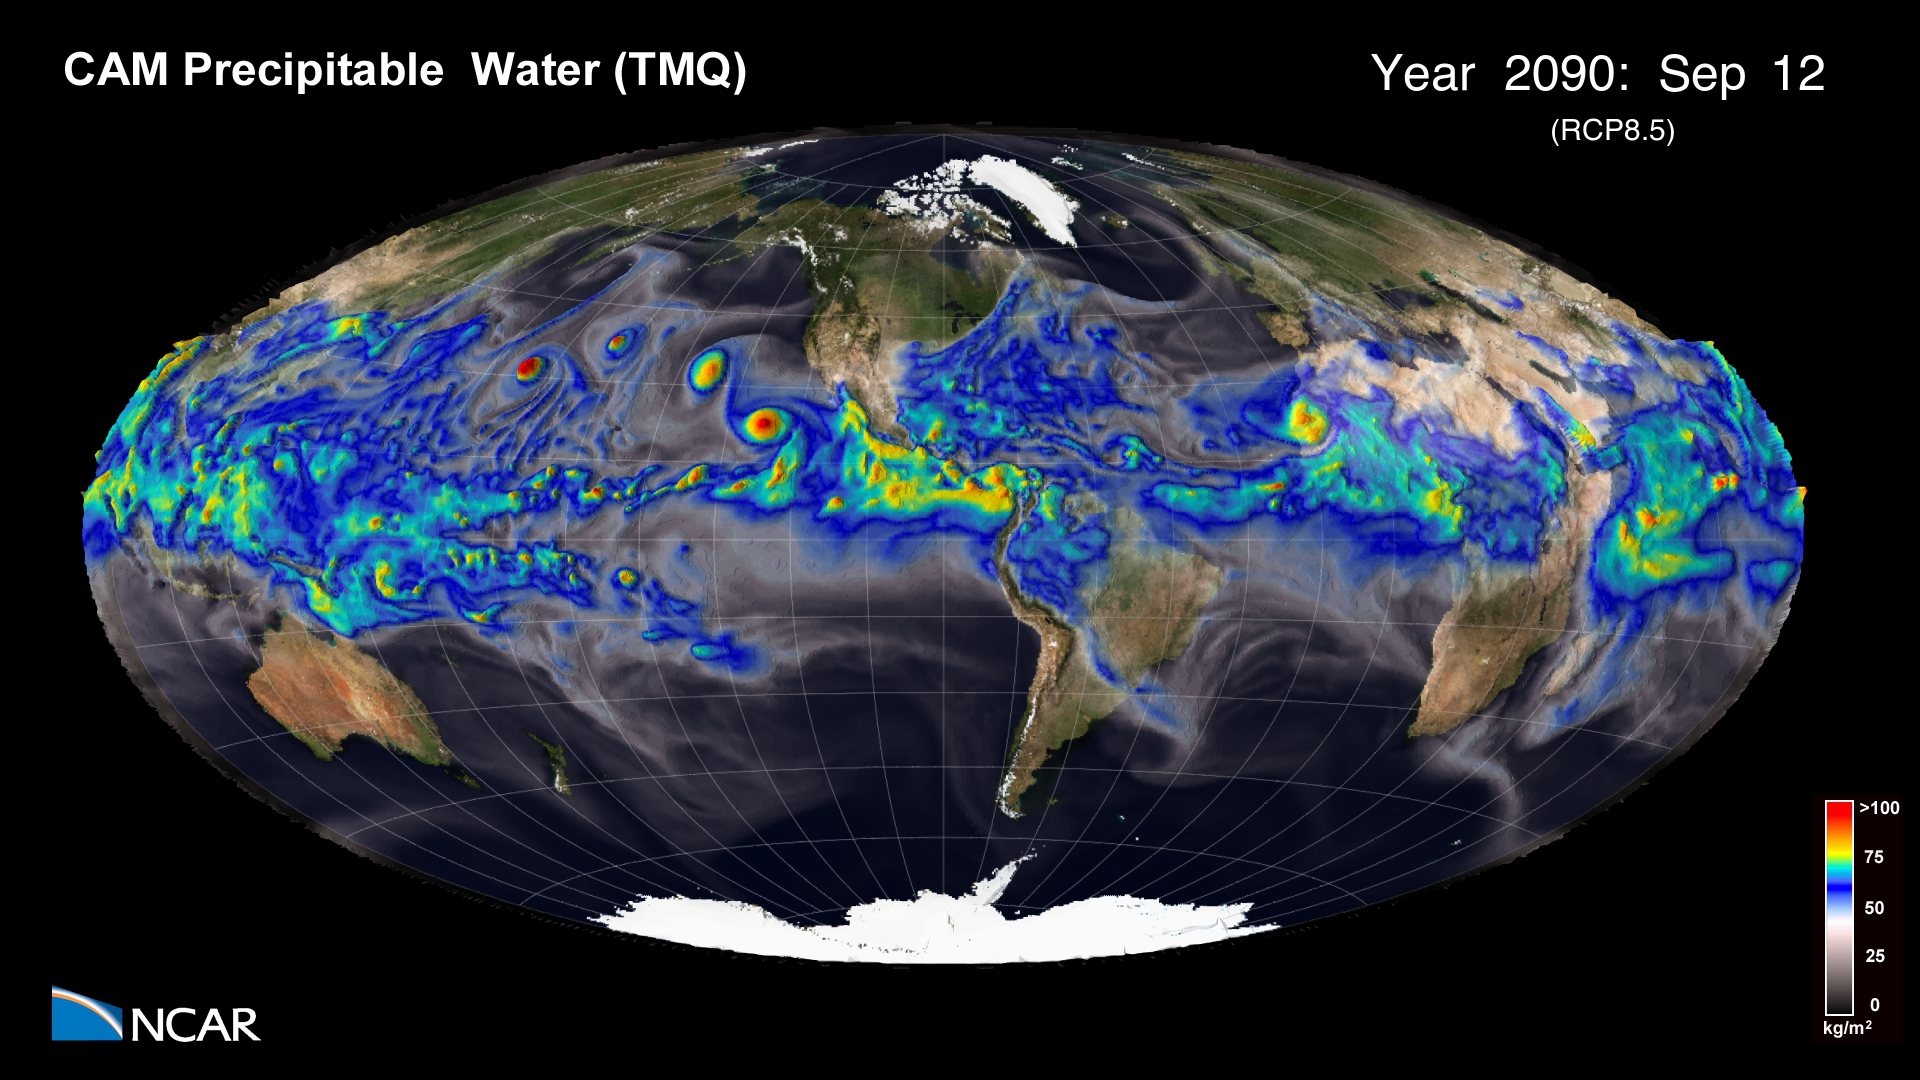
This simulation shows a comparison between present day (1990) and future (2090) precipitable water in the Earth’s atmosphere using an RCP8.5 emissions scenario. Movies Movie File (.mov, 1920×1080, 236MB) Images Science Credits This simulation was made possible because of the large number of individuals both from within NCAR and the many outside collaborators who have…
Read moreTotal Accumulation of Global Precipitation
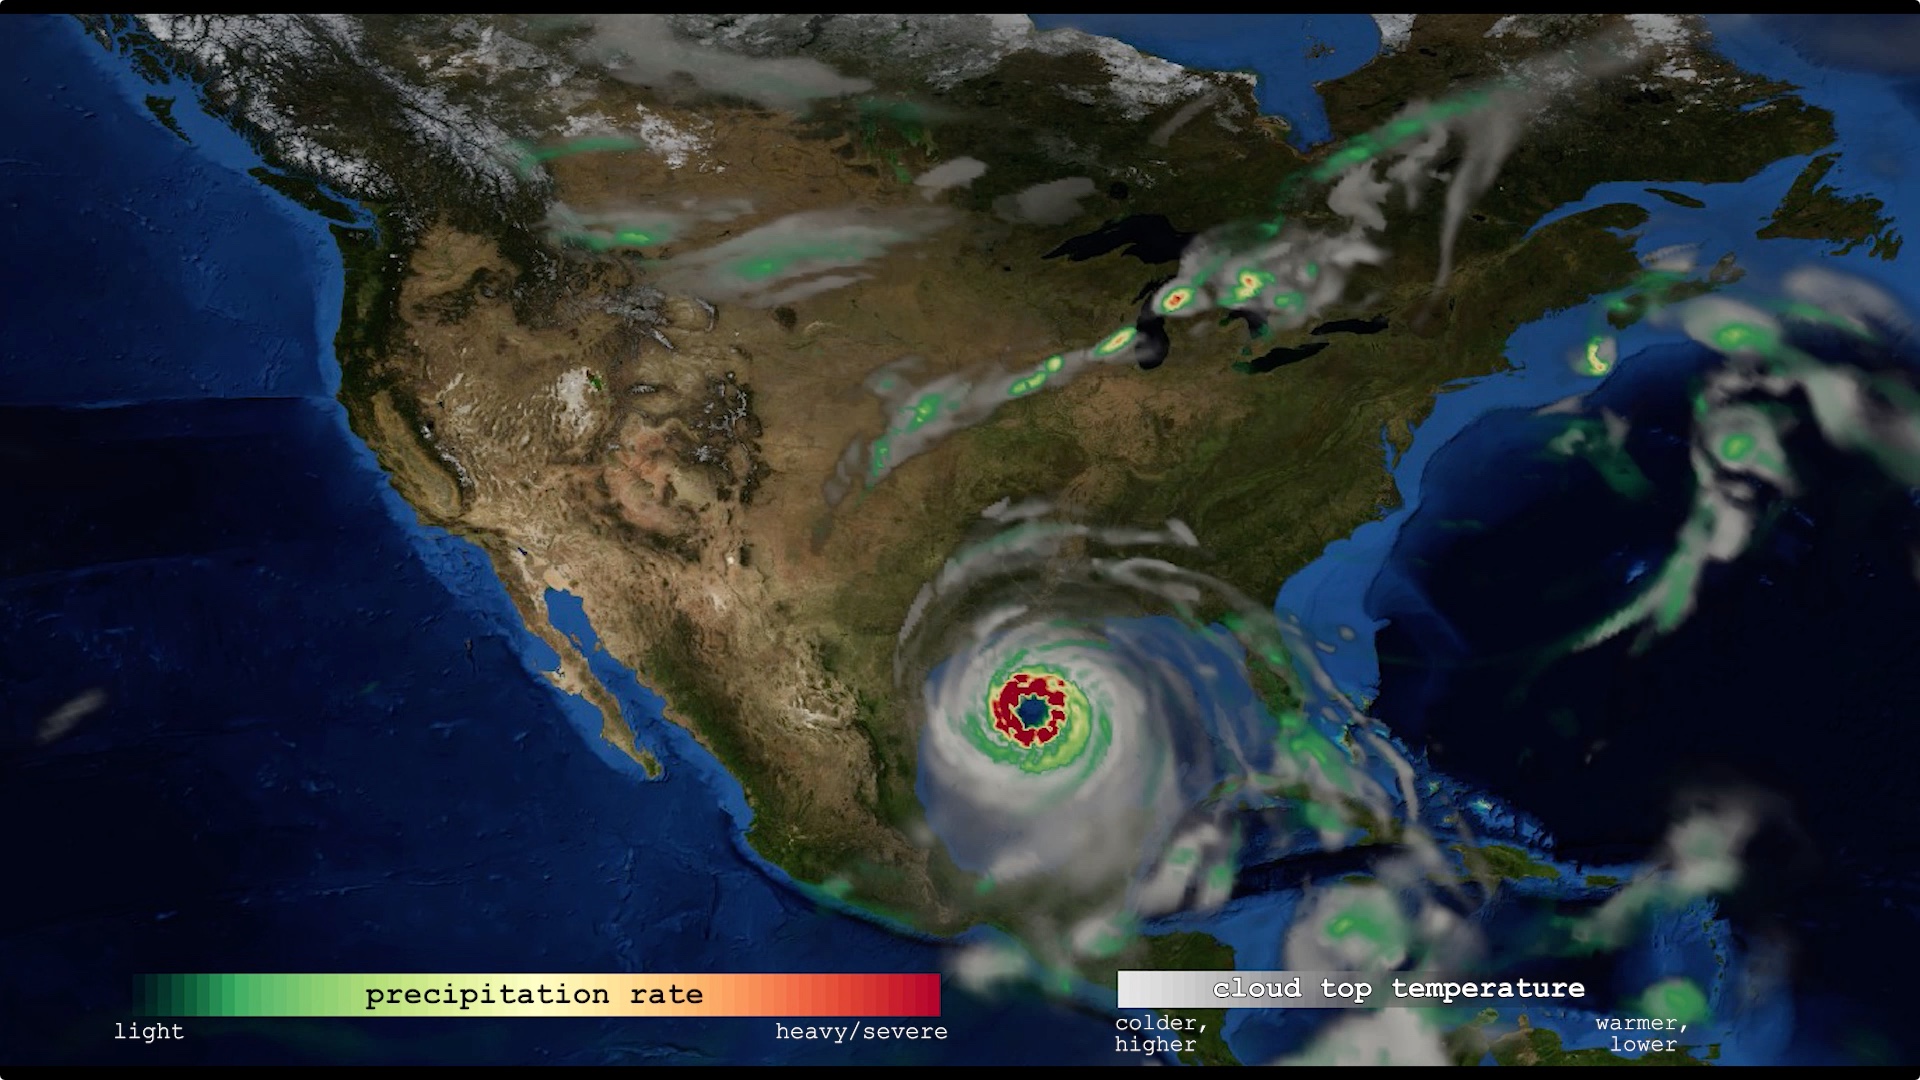
Project Metis: Seasonal Forecasts with Enhanced Ocean and Atmosphere Resolution This visualization shows total accumulation of global precipitation (blue/purple) and the 6-hourly precipitation (yellow/red) between May 1 and Nov 1, 2015. What to look for: Of particular interest are the cyclones that scrawl lines across the map, leaving a visible trail in the total precipitation field. Movies Movie…
Read moreVariable Resolution Regional Climate Simulations with CESM
This visualization shows the output from a Variable Resolution Regional Climate Simulations with CESM (Community Earth System Model). Movies Movie File (.mp4, 319MB, 1920×1080) Images Computational Modeling Colin Zarzycki, Andrew Gettelman, Peter Lauritzen and Patrick Callaghan (NCAR/CGD) Visualization and Post-production John Clyne and Matt Rehme (NCAR/CISL) Model Variable Resolution Regional Climate Simulations with CESM (Community…
Read more