
The simulation shows the far reaching effect of the Tonga eruption. The animation also demonstrates how waves connect the atmosphere and the space environment. Movies Captions only Narration only https://vastgallery.s3.us-west-1.amazonaws.com/Weather/TongaEruption/v6_FinalBeforeCaptions_withVoiceOver.mp4 Science Credits Han-Li Liu Computational Modeling Han-Li Liu, Peter Lauritzen, Francis Vitt, Steve Goldhaber Computational Resources NWSC/Cheyenne; NASA/Pleiades Visualization and Post-production Matt Rehme, Sarah Vitt…
Read moreCategory: CESM
Leveraging Variable Resolution Capabilities in the Community Earth System Model (CESM) – Greenland
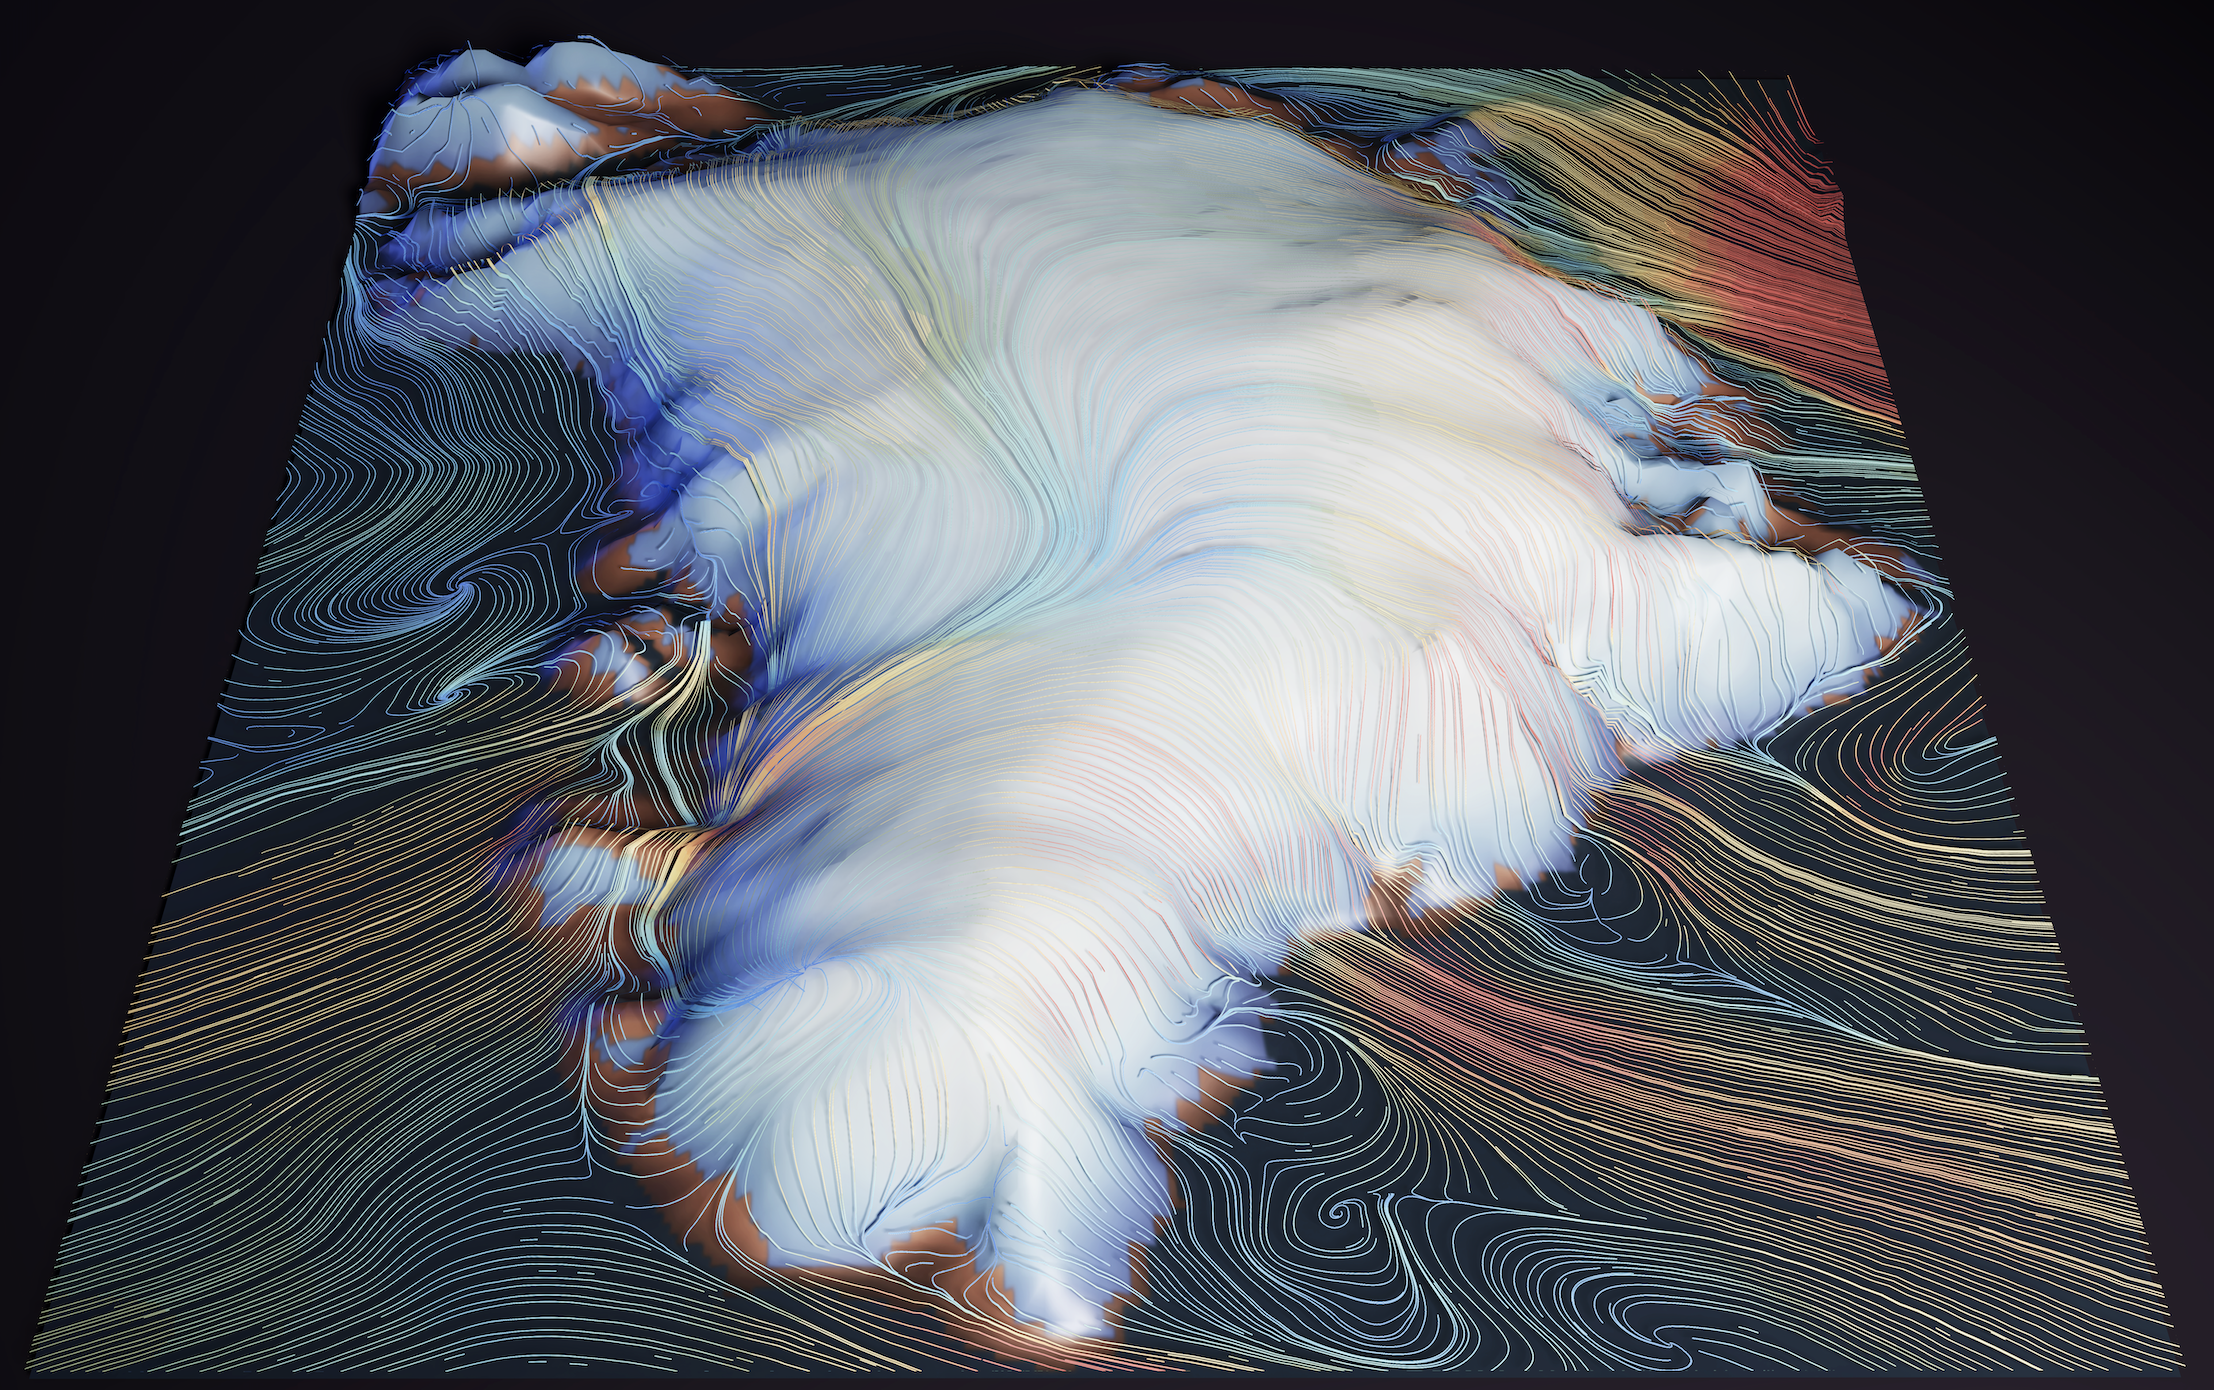
The System for Integrated Modeling of the Atmosphere (SIMA) has rolled out two new variable-resolution configurations with regional refinement over the Arctic and Greenland*. This is a 3D visualization of a simulation using the Greenland grid, which refines the big ice sheet with 1/8˚ grid resolution. The visualization shows that storms traverse the refinement region…
Read morePresent and Future Climate in a Global Model
This visualization shows a CESM1 model comparison between a present day (1990) and a future (2090) simulation using a business-as-usual or high emissions scenario, called RCP8.5. Clouds represent six-hourly time steps of total water vapor for one year. Technically speaking, this is the CESM1 model variable, TMQ, defined as the total precipitable water (vertically integrated)…
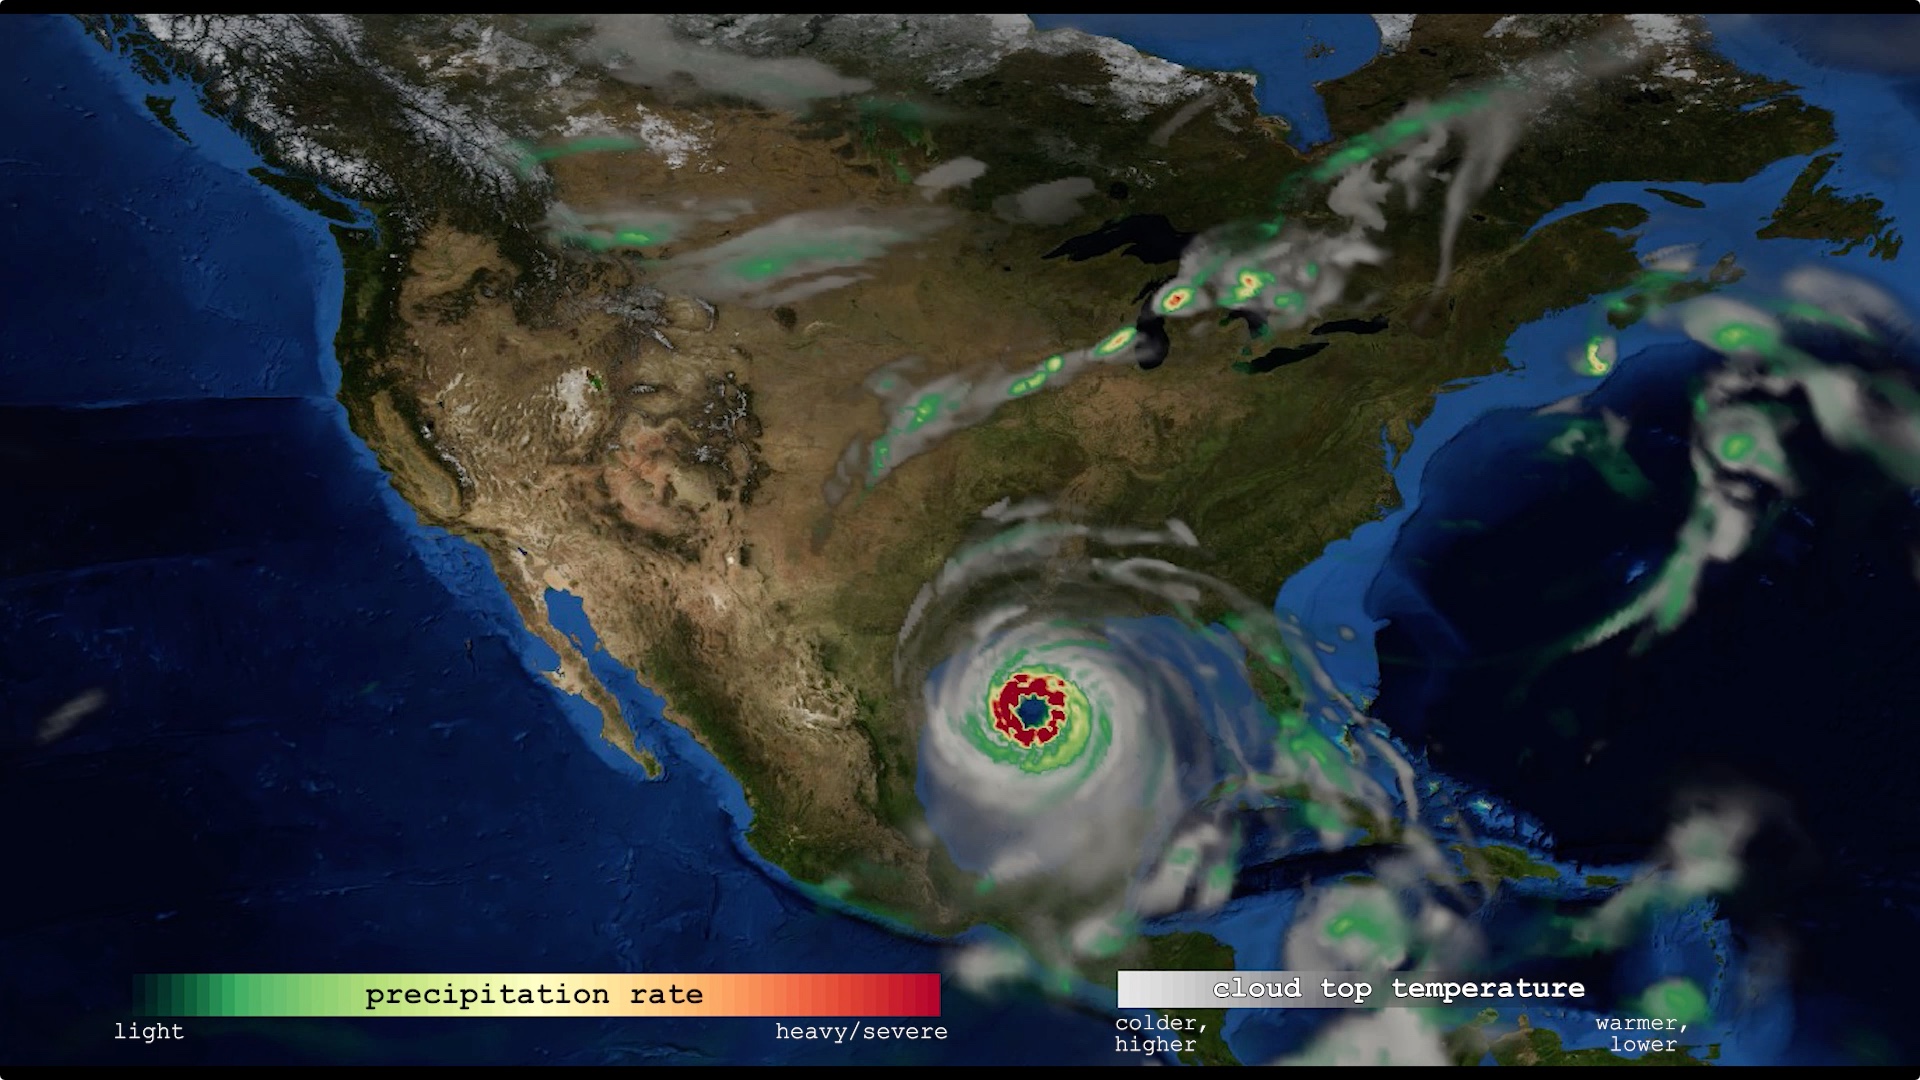
Read moreClimate Change: Precipitation
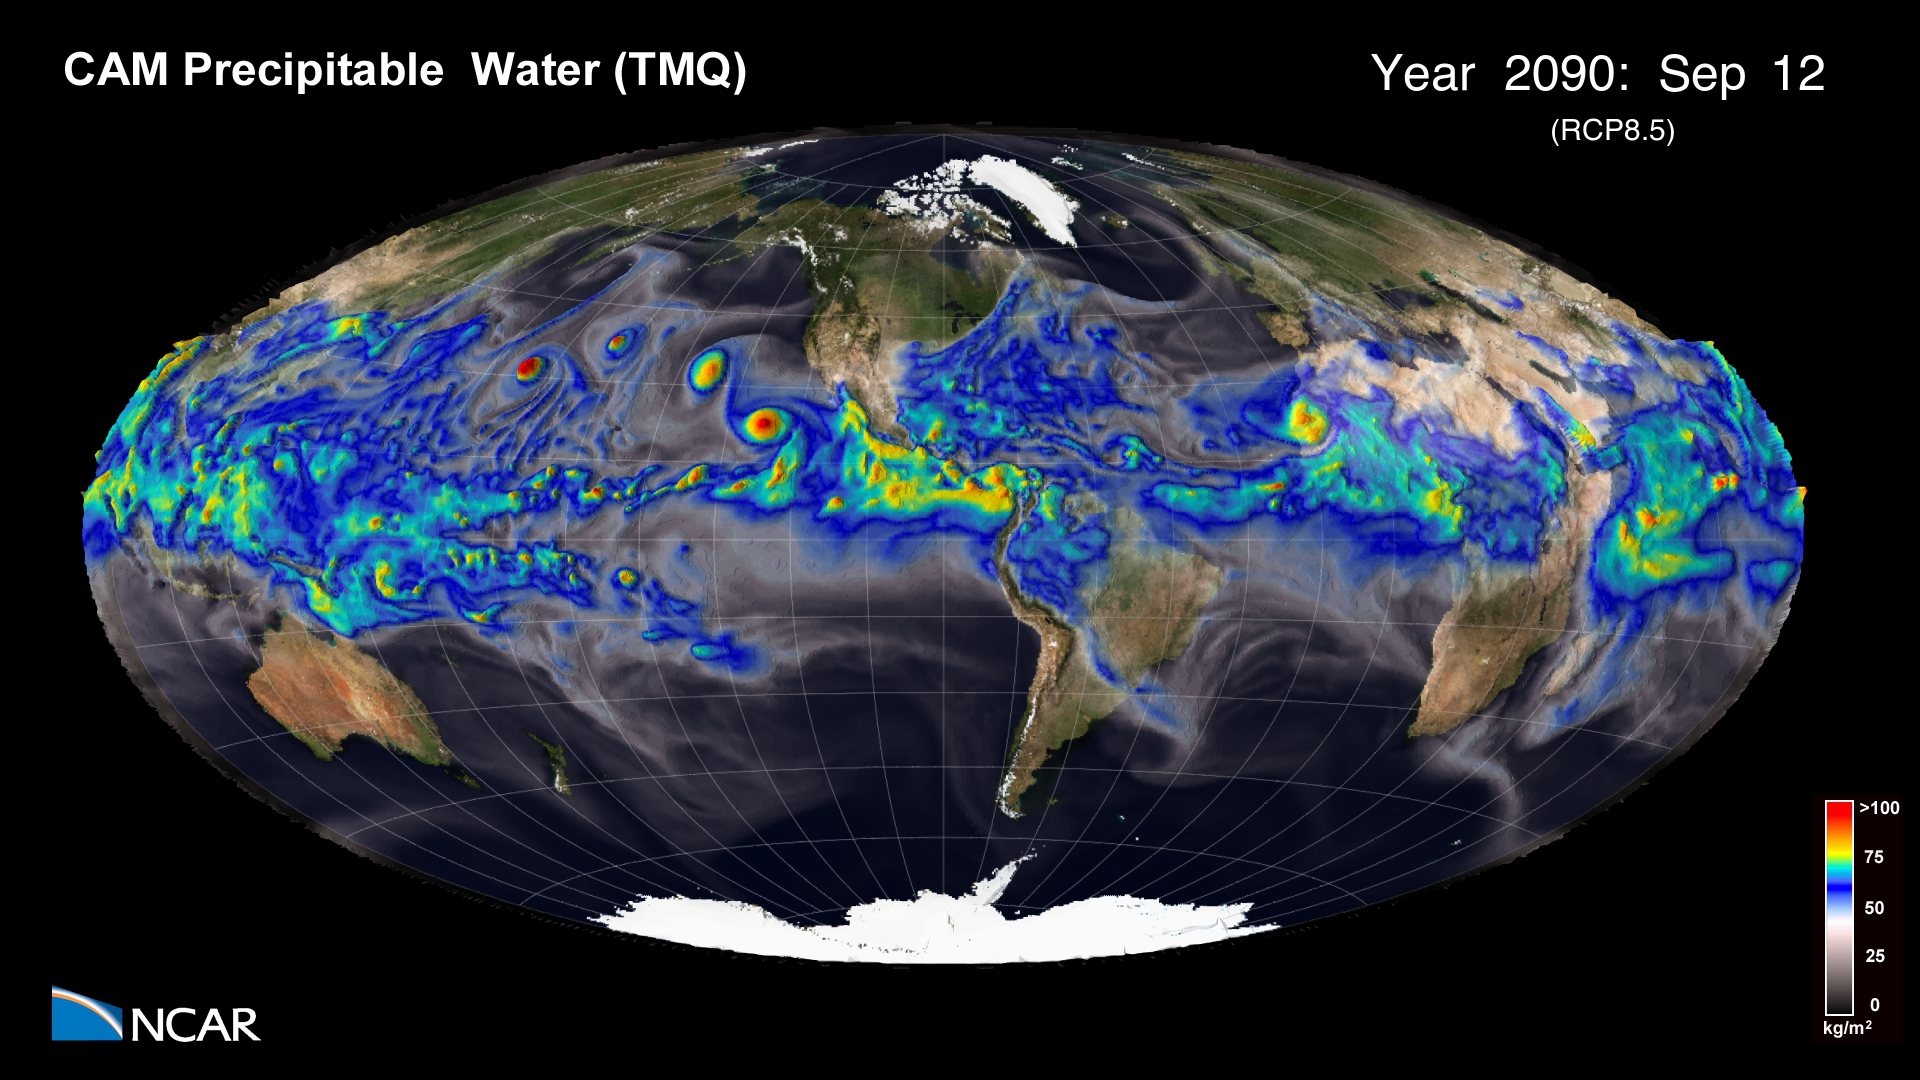
This simulation shows a comparison between present day (1990) and future (2090) precipitable water in the Earth’s atmosphere using an RCP8.5 emissions scenario. Movies Movie File (.mov, 1920×1080, 236MB) Images Science Credits This simulation was made possible because of the large number of individuals both from within NCAR and the many outside collaborators who have…
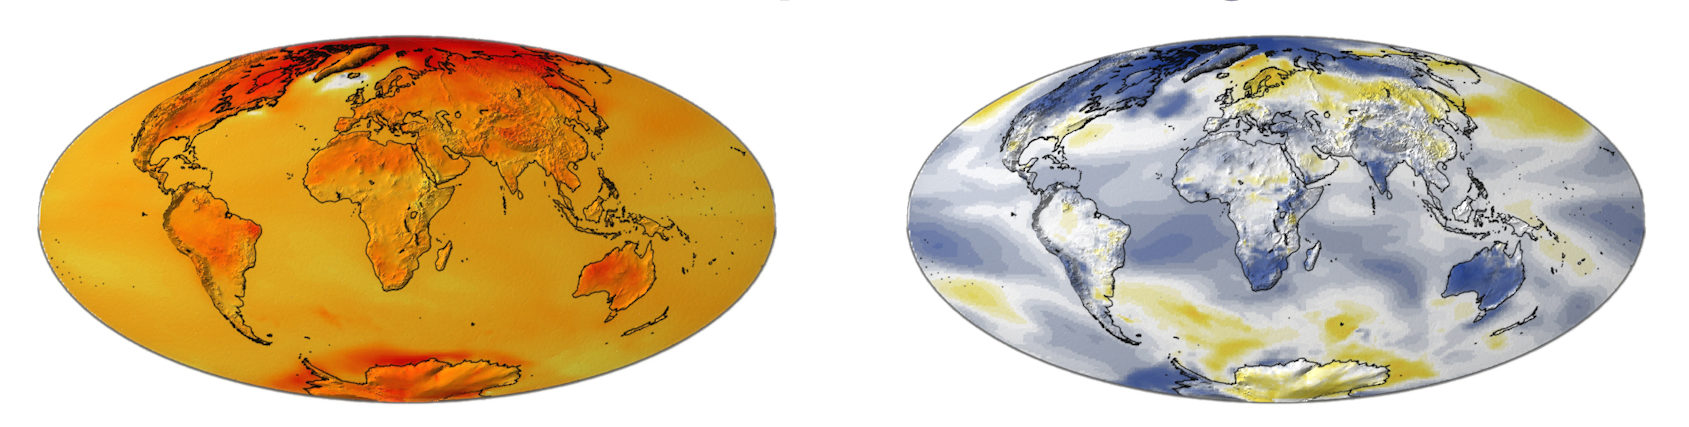
Read moreClimate Change: Temperature Anomalies
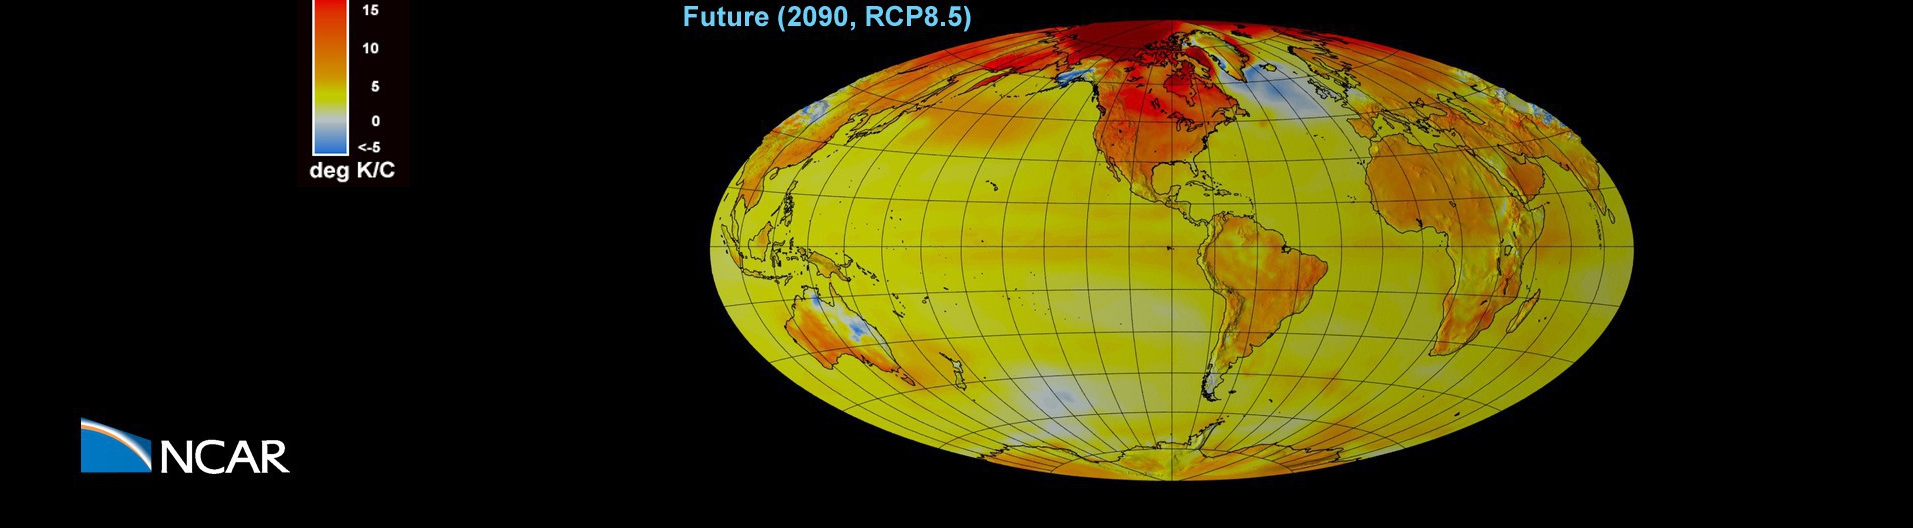
A comparison between present and future (RCP8.5) surface temperature anomalies. A 3-day smoothing has been applied to the output to dampen day to day variability. Movies Movie File (.mov, 118MB, 1920×1080) Images Computational Modeling Nan Rosenbloom and Gary Strand (NCAR/CGD) Visualization and Post-production Tim Scheitlin and Matt Rehme (NCAR/CISL) Model CESM Visualization Software NCAR Command…
Read moreNegative NAO Triggered by Stratospheric Sudden Warming
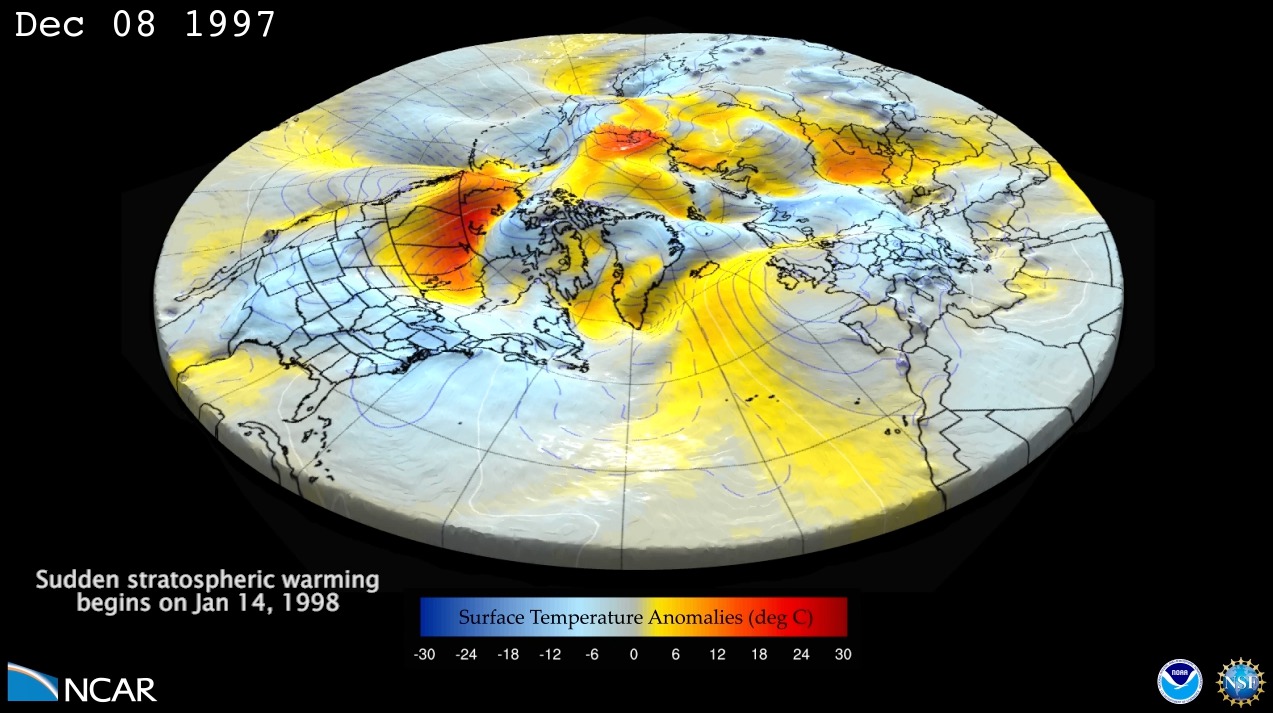
Seasonal forecast for winter of 1997/1998 with 46LCAM (Ensemble member with a sudden stratospheric warming). This is a 4 month forecast of surface geopotential height anomalies (shown with surface relief and contour lines) and surface temperature anomalies (shown with a color gradient). The forecast starts on Dec 1, 1997, and goes through the end of…
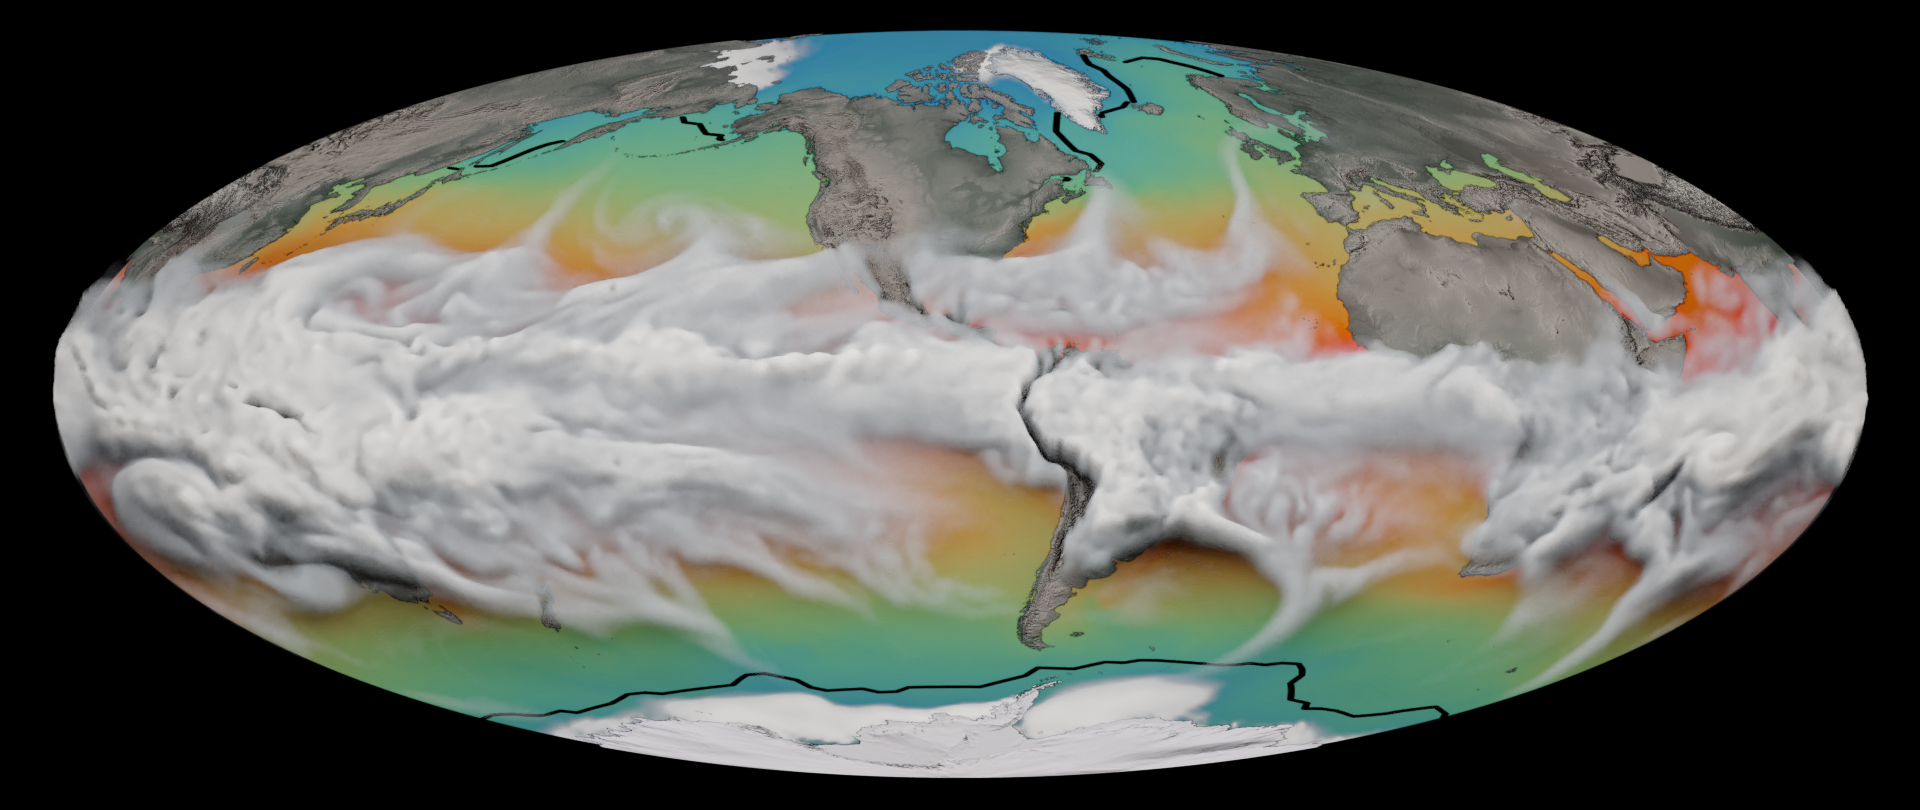
Read moreOcean impact on atmospheric oxygen and carbon dioxide
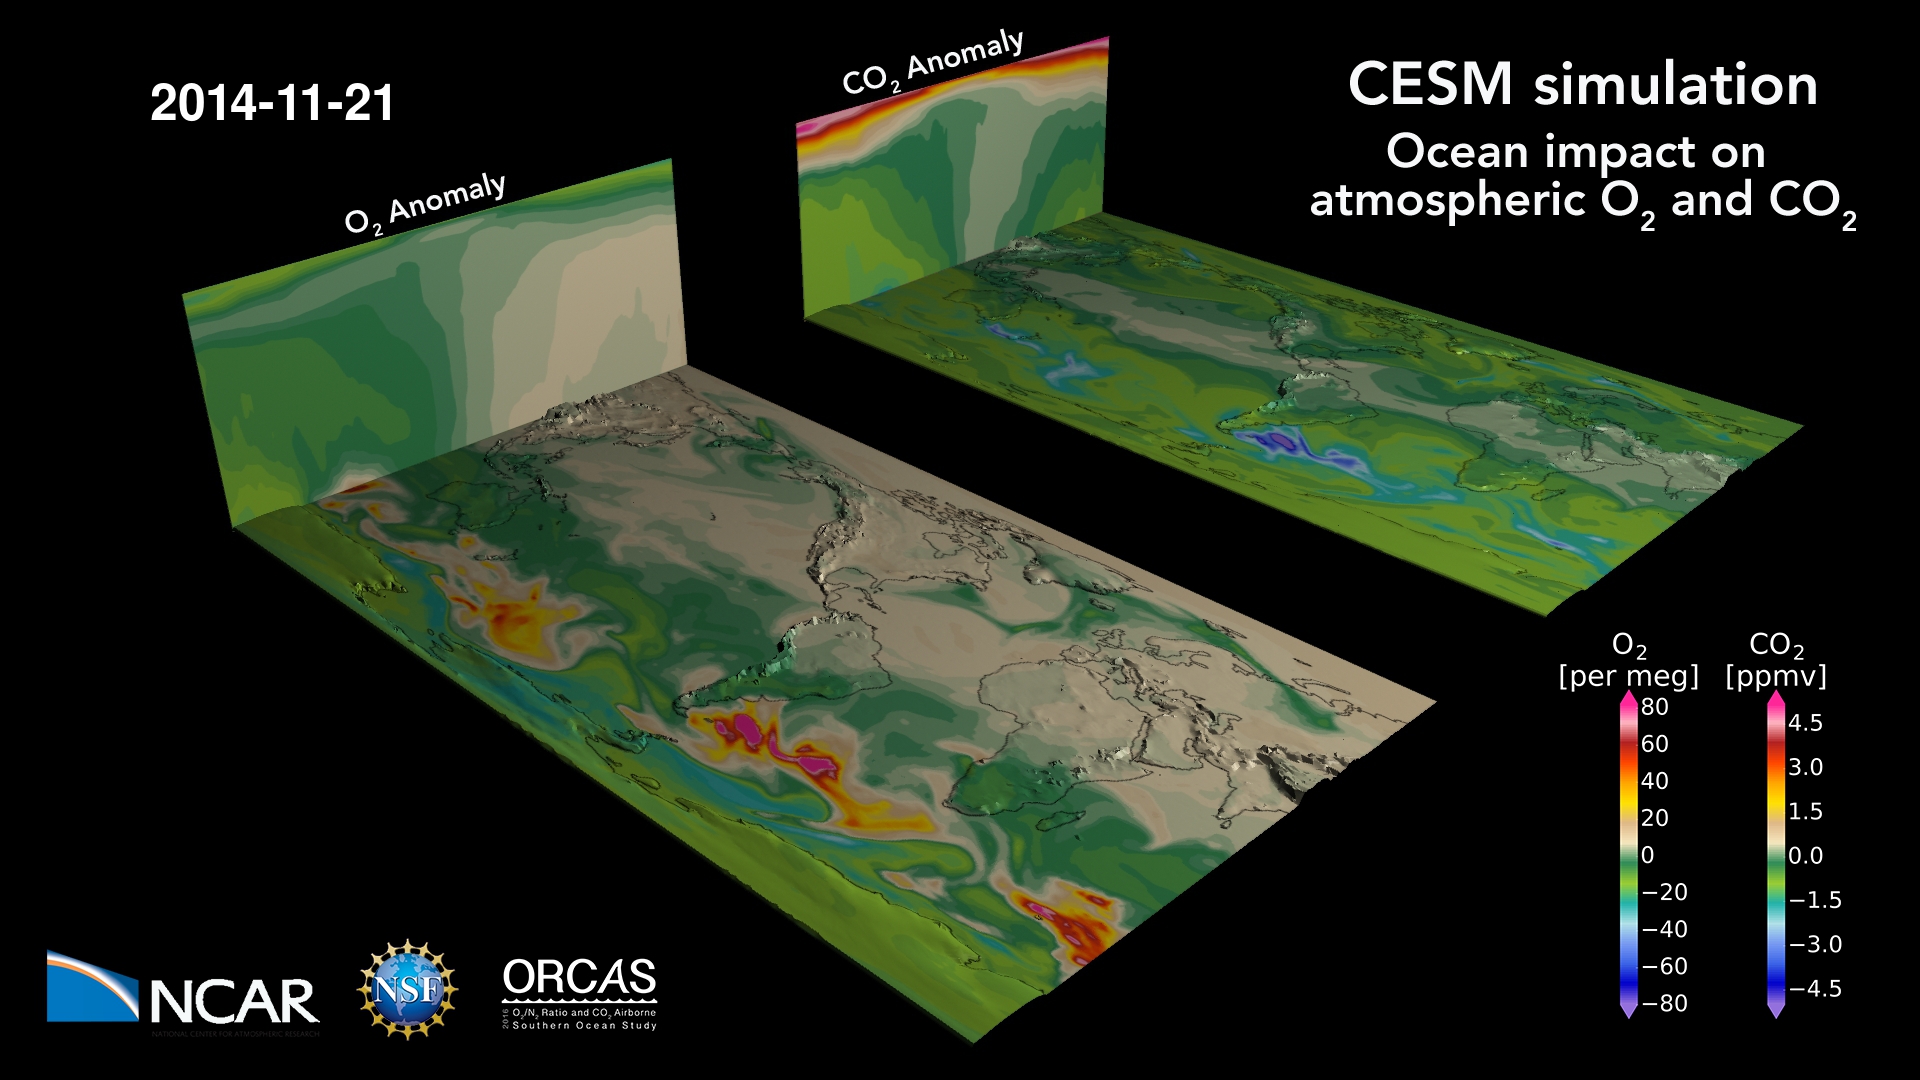
The ocean breathes: a map of oxygen and carbon dioxide variations in the atmosphere due to air-sea gas exchange, stirred by winds. The ocean absorbs CO2 and releases O2 in the summer hemisphere, primarily due to photosynthesis (and warming, for O2) at the surface; the reverse happens during winter when the surface cools and deep…
Read moreVariable Resolution Regional Climate Simulations with CESM
This visualization shows the output from a Variable Resolution Regional Climate Simulations with CESM (Community Earth System Model). Movies Movie File (.mp4, 319MB, 1920×1080) Images Computational Modeling Colin Zarzycki, Andrew Gettelman, Peter Lauritzen and Patrick Callaghan (NCAR/CGD) Visualization and Post-production John Clyne and Matt Rehme (NCAR/CISL) Model Variable Resolution Regional Climate Simulations with CESM (Community…
Read moreSurface Temperatures from Climate Change vs. Geoengineering
This visualization describes temperature changes relative to years 2015-2024 from unabated climate change (RCP8.5) and stratospheric sulfate aerosol geoengineering (using feedback) simulated by a state-of-the-art coupled earth system model. Geoengineering, often using stratospheric sulfate aerosols, is discussed as a potential means of deliberately offsetting some of the effects of climate change, such as rising temperatures.…
Read moreWind Speed
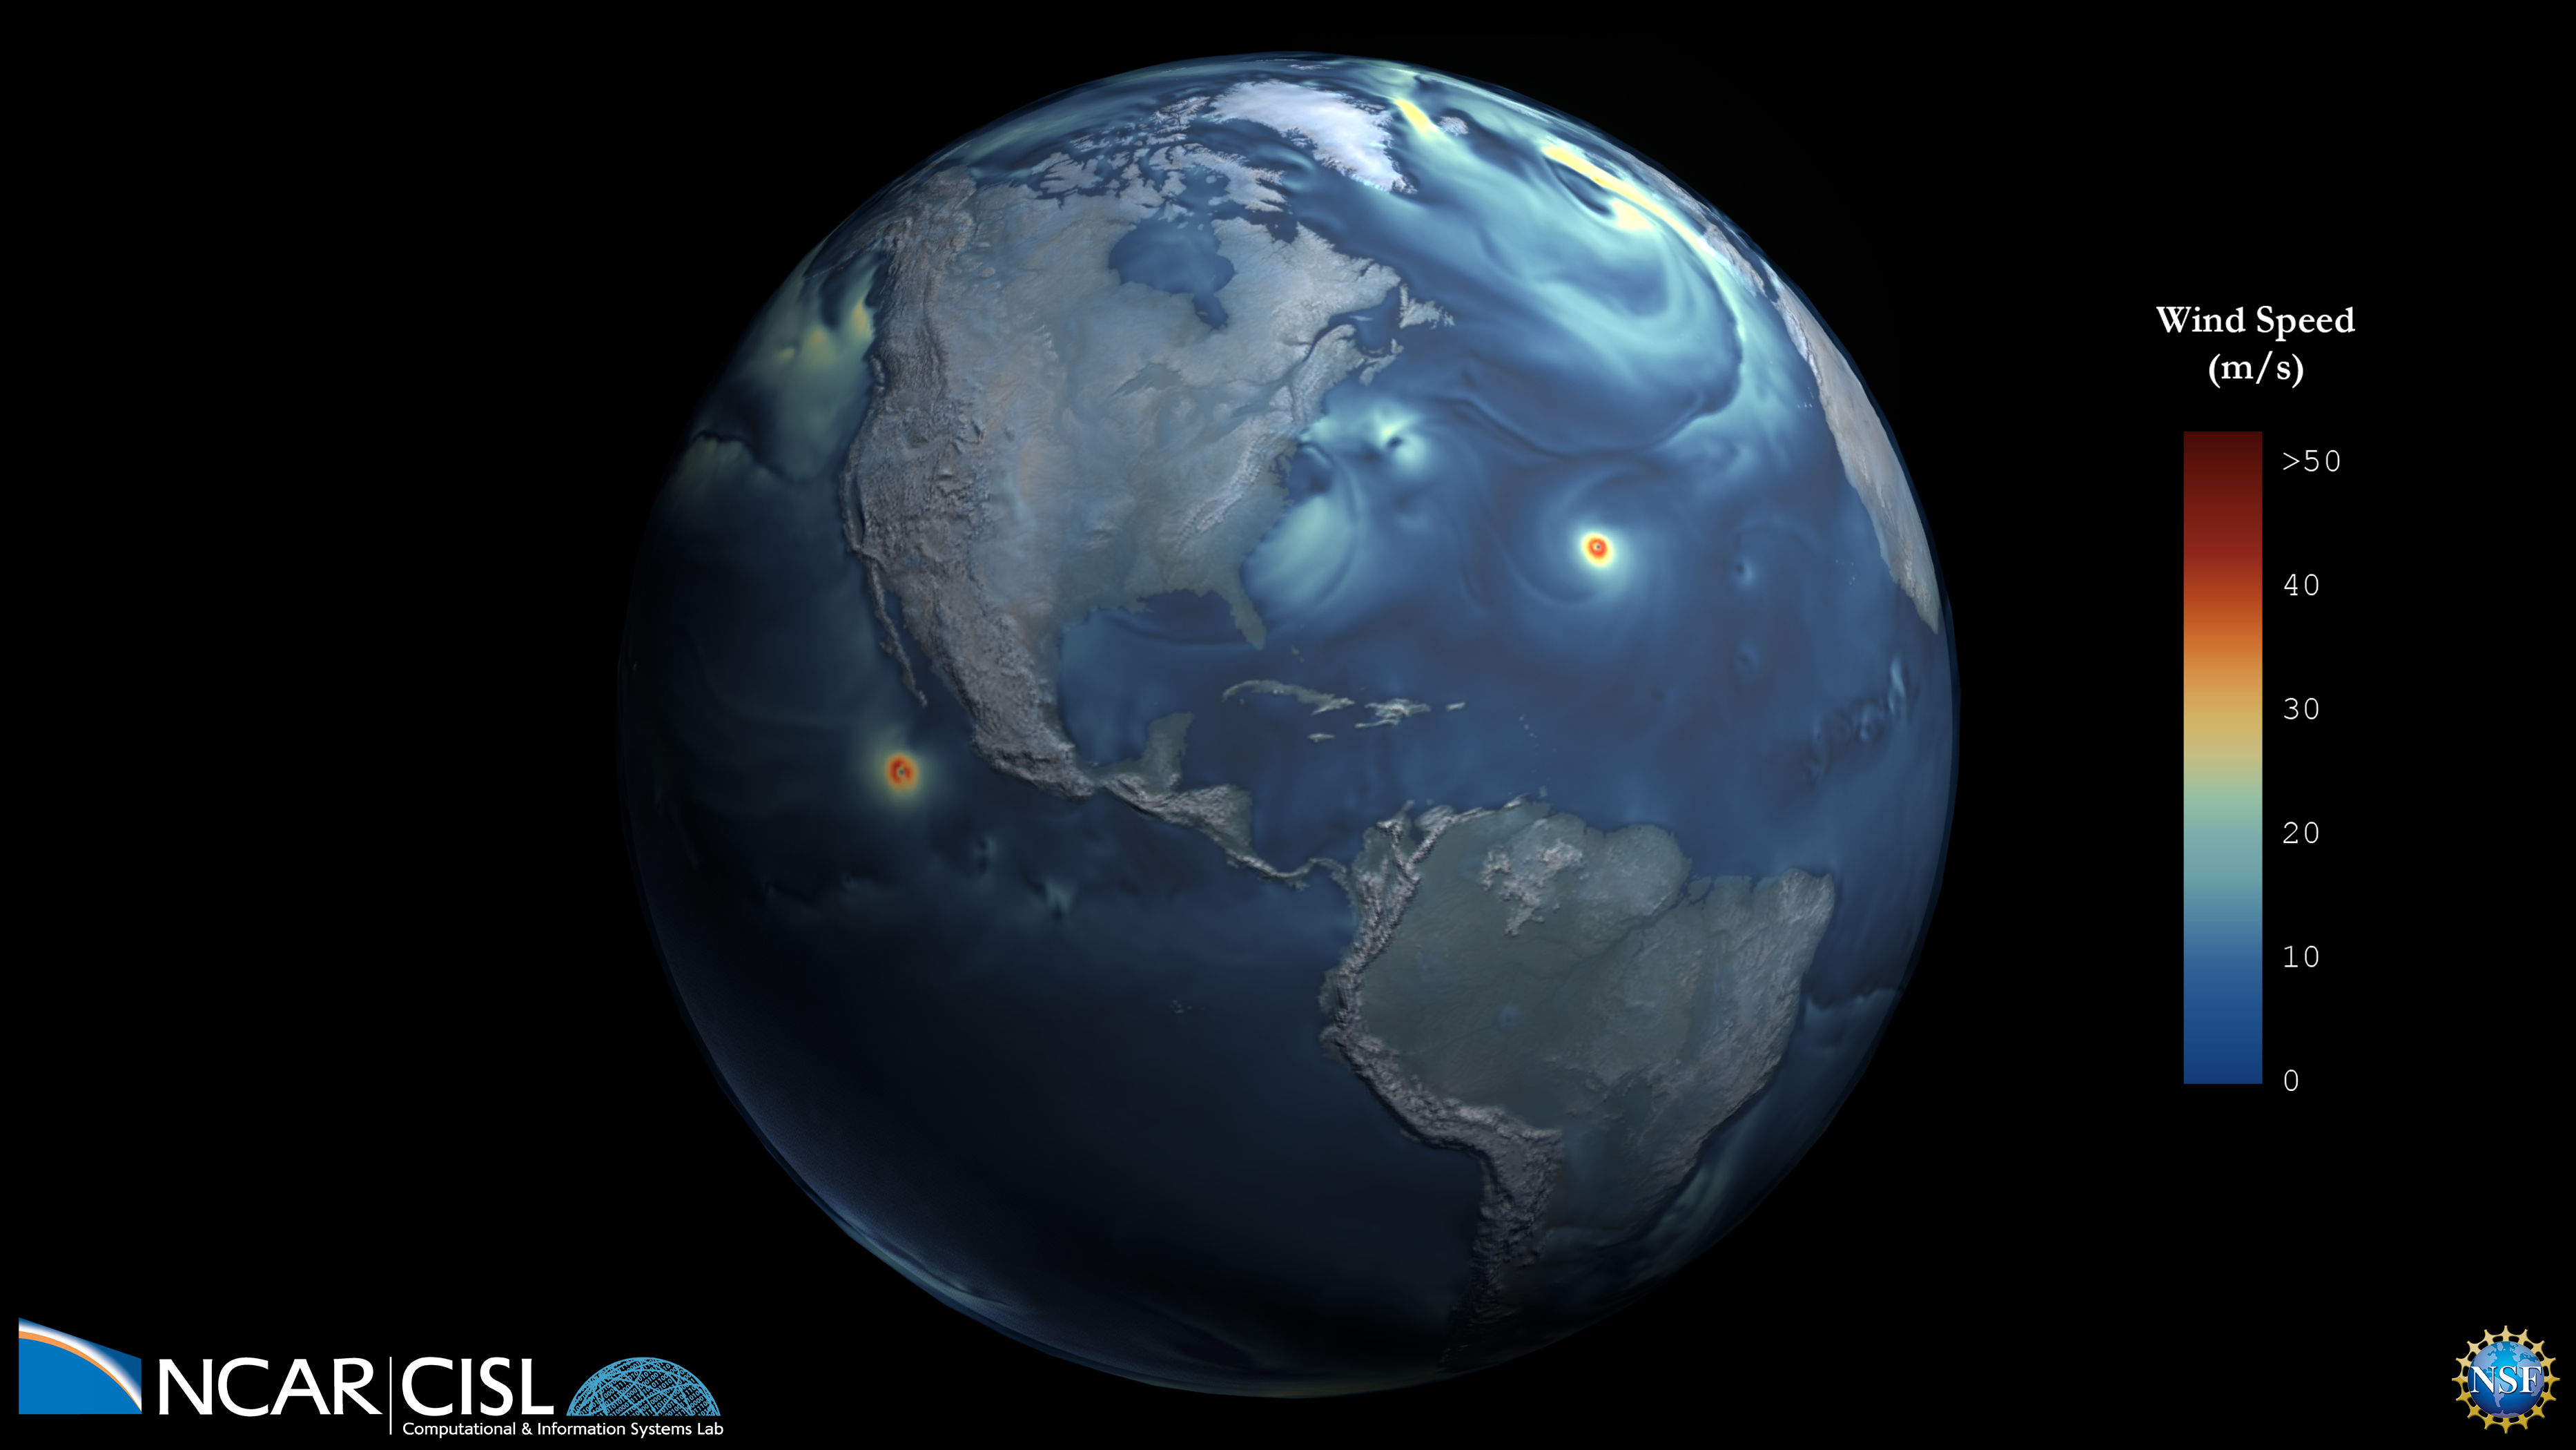
This visualization shows the magnitude of the wind speed over the course of one year from atmosphere-only simulations of the high resolution (horizontal 1/4 degree) Community Earth System Model simulating the present day climate. Movies Movie File (.mp4, 1920×1080, 588MB) Images Science Credits Susan Bates and Nan Rosenbloom Computational Resources This research used resources…
Read more