
The simulation shows the far reaching effect of the Tonga eruption. The animation also demonstrates how waves connect the atmosphere and the space environment. Movies Captions only Narration only https://vastgallery.s3.us-west-1.amazonaws.com/Weather/TongaEruption/v6_FinalBeforeCaptions_withVoiceOver.mp4 Science Credits Han-Li Liu Computational Modeling Han-Li Liu, Peter Lauritzen, Francis Vitt, Steve Goldhaber Computational Resources NWSC/Cheyenne; NASA/Pleiades Visualization and Post-production Matt Rehme, Sarah Vitt…
Read moreCategory: Visualization Software
WRF-Fire: East Troublesome Wildfire from Granby, CO
On October 14, 2020, the East Troublesome Wildfire ignited. It burnt 193,812 acres over the course of 48 days. Between October 20-23 the wildfire rapidly intensified, exploding from 18,550 acres to 187,964 acres in size.* These visualizations show a Weather Research & Forecasting (WRF) simulation of the East Troublesome Wildfire from the perspective of Granby,…
Read moreSimulations with MUSICA (Multi-Scale Infrastructure for Chemistry Modeling)
These visualizations depict simulations created with MUSICA (Multi-Scale Infrastructure for Chemistry Modeling). The first simulation examines the Carbon Monoxide (CO) generated by a fire plume during the major fire events that occurred in the western United States in 2022. The second simulation depicts Ozone (O3) in the troposphere over a region of the western US…
Read moreWeather Systems in a World without Land or Seasons
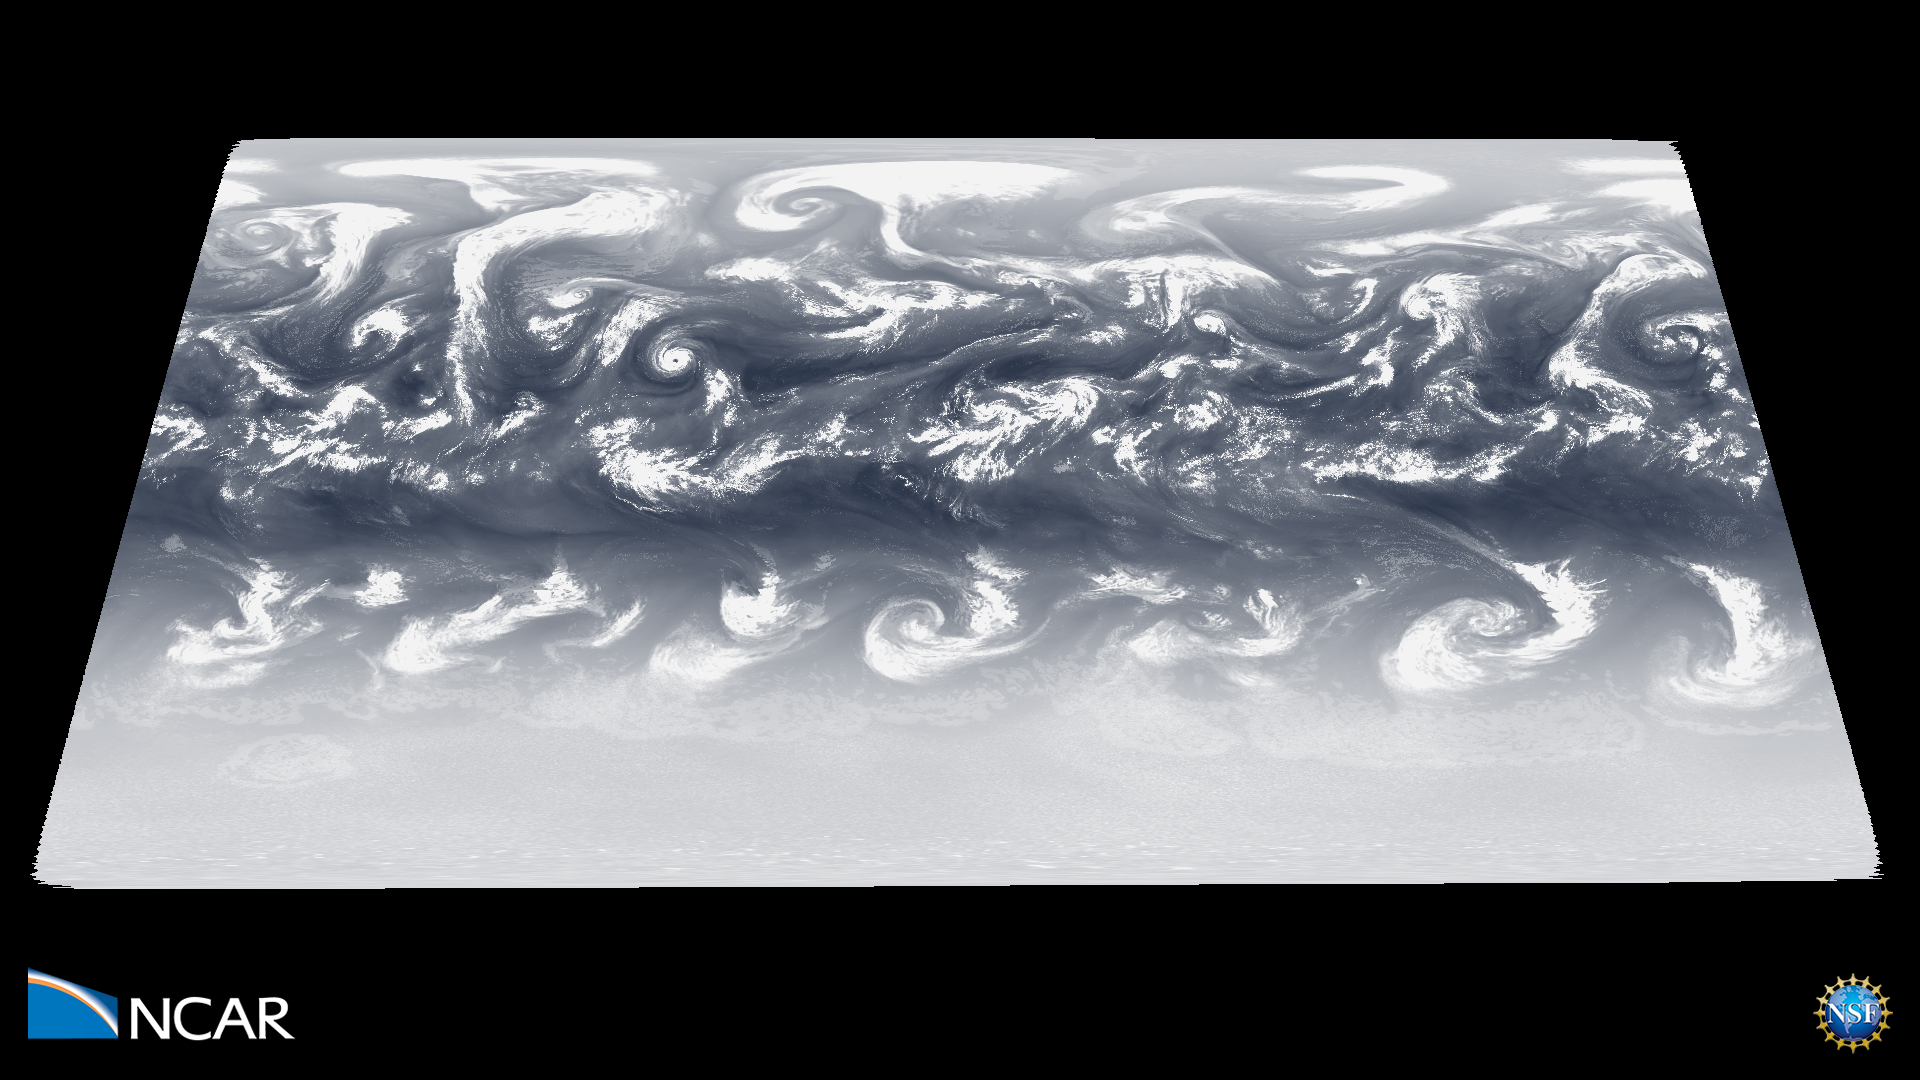
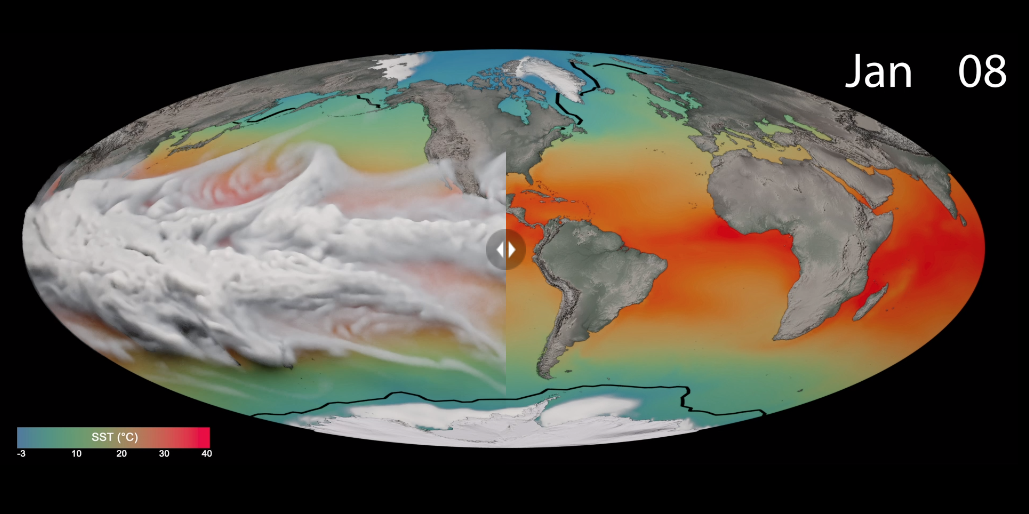
Aquaplanet simulations—as their name suggests—are idealized representations of Earth where the planet is covered entirely by water. The absence of continents, while unrealistic, provides a clean laboratory where weather systems can develop, evolve, and dissipate as they would do over Earth’s oceans. This kind of simulation is, therefore, useful for learning about the fundamental processes…
Read moreOcean Surface Boundary Layer Turbulence Under Hurricane Irene

Simulated ocean surface boundary layer turbulence under Hurricane Irene (~9:30 UTC, August 28, 2011) entrains cold bottom water that cools the sea surface and weakens the hurricane as it makes landfall on the New Jersey continental shelf. Large-aspect-ratio coherent structures that modify the evolution of the mean sea-surface temperature are highlighted in a 2 km by 2…
Read moreCoalescing Droplets in Turbulence
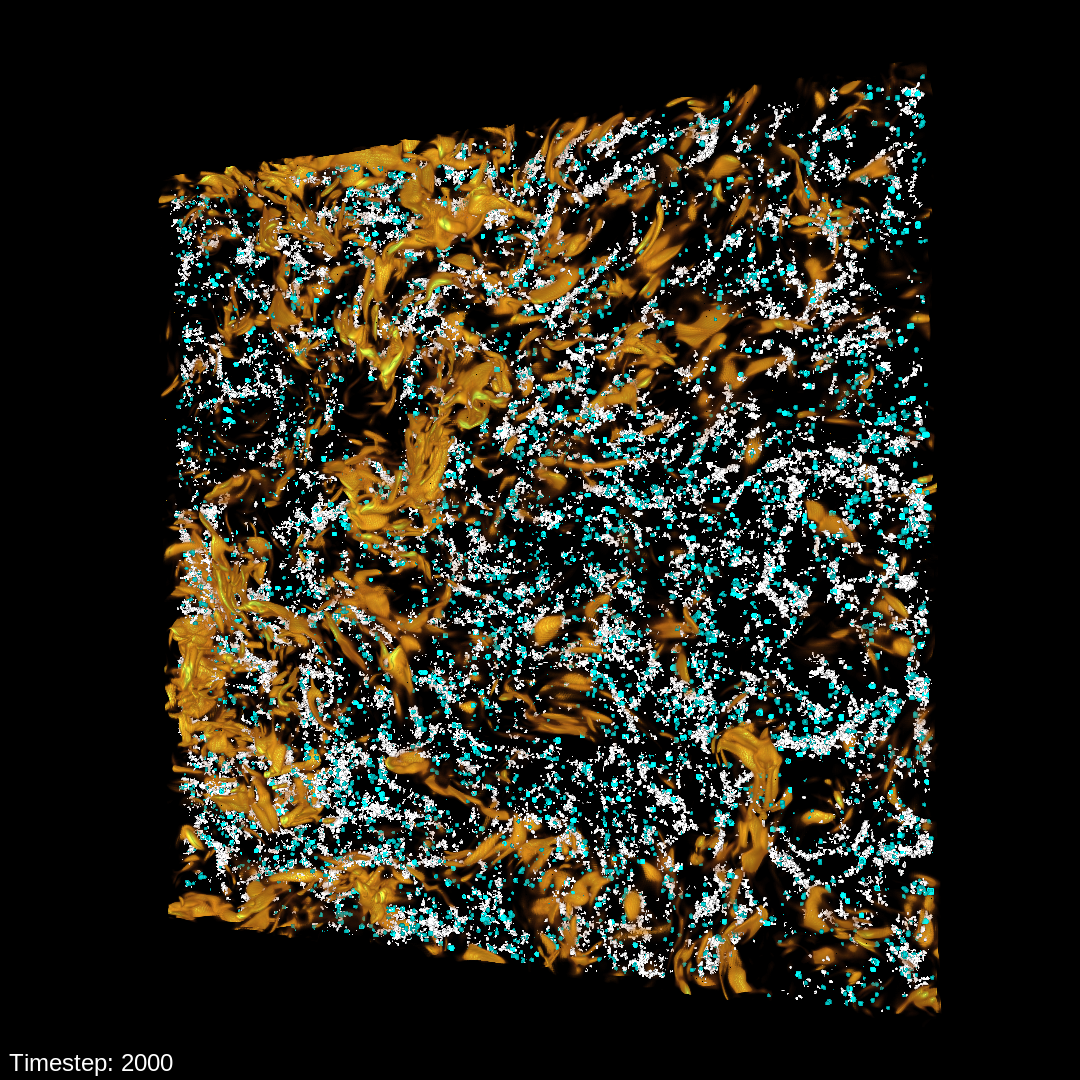
Precipitation in warm clouds can be explained by coalescing water droplets. This coalescence can be accelerated by turbulent vortices within the cloud. In this visualization, we see how this turbulence drives the coalescence of large and small droplets. Movies Movie File (.mp4, 224MB, 1920×1080) Images Science Credits Melanie Li Sing How (Cornell), Lance Collins…
Read moreHRRR Smoke in the Summer of 2020
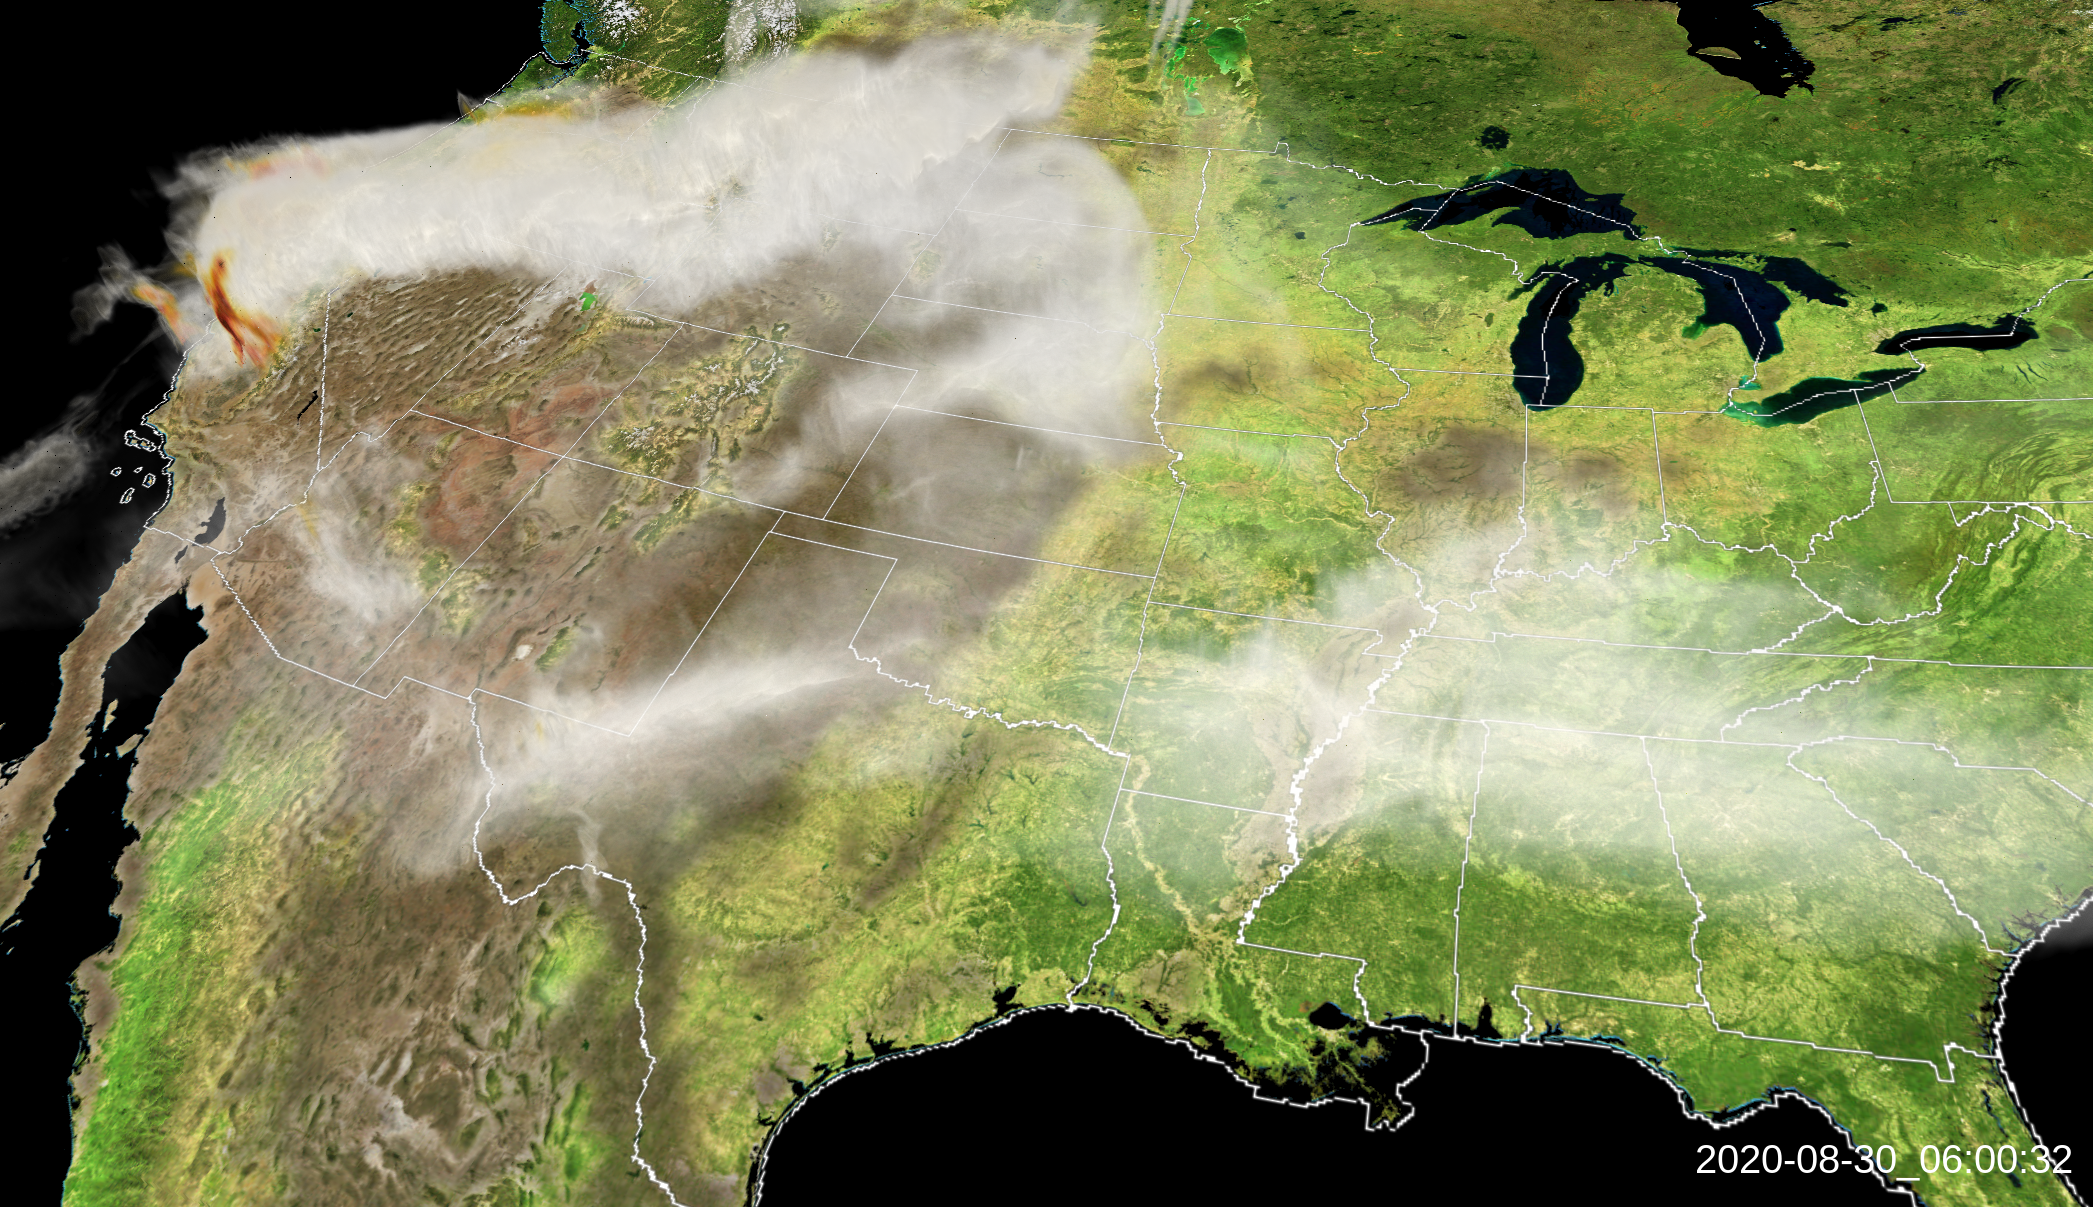
These volume renderings show the simulated dispersal of smoke generated with the High Resolution Rapid Refresh (HRRR) model. This visualization emphasizes the Western wildfires during the last days of August, 2020. Science credit to Ka Yee Wong and Ravan Ahmadov, of NOAA’s Global Systems Laboratory. Movies Movie File (430 KB, MP4) Images Science…
Read moreWater Vapor Content of the Current and Future Climate of North America
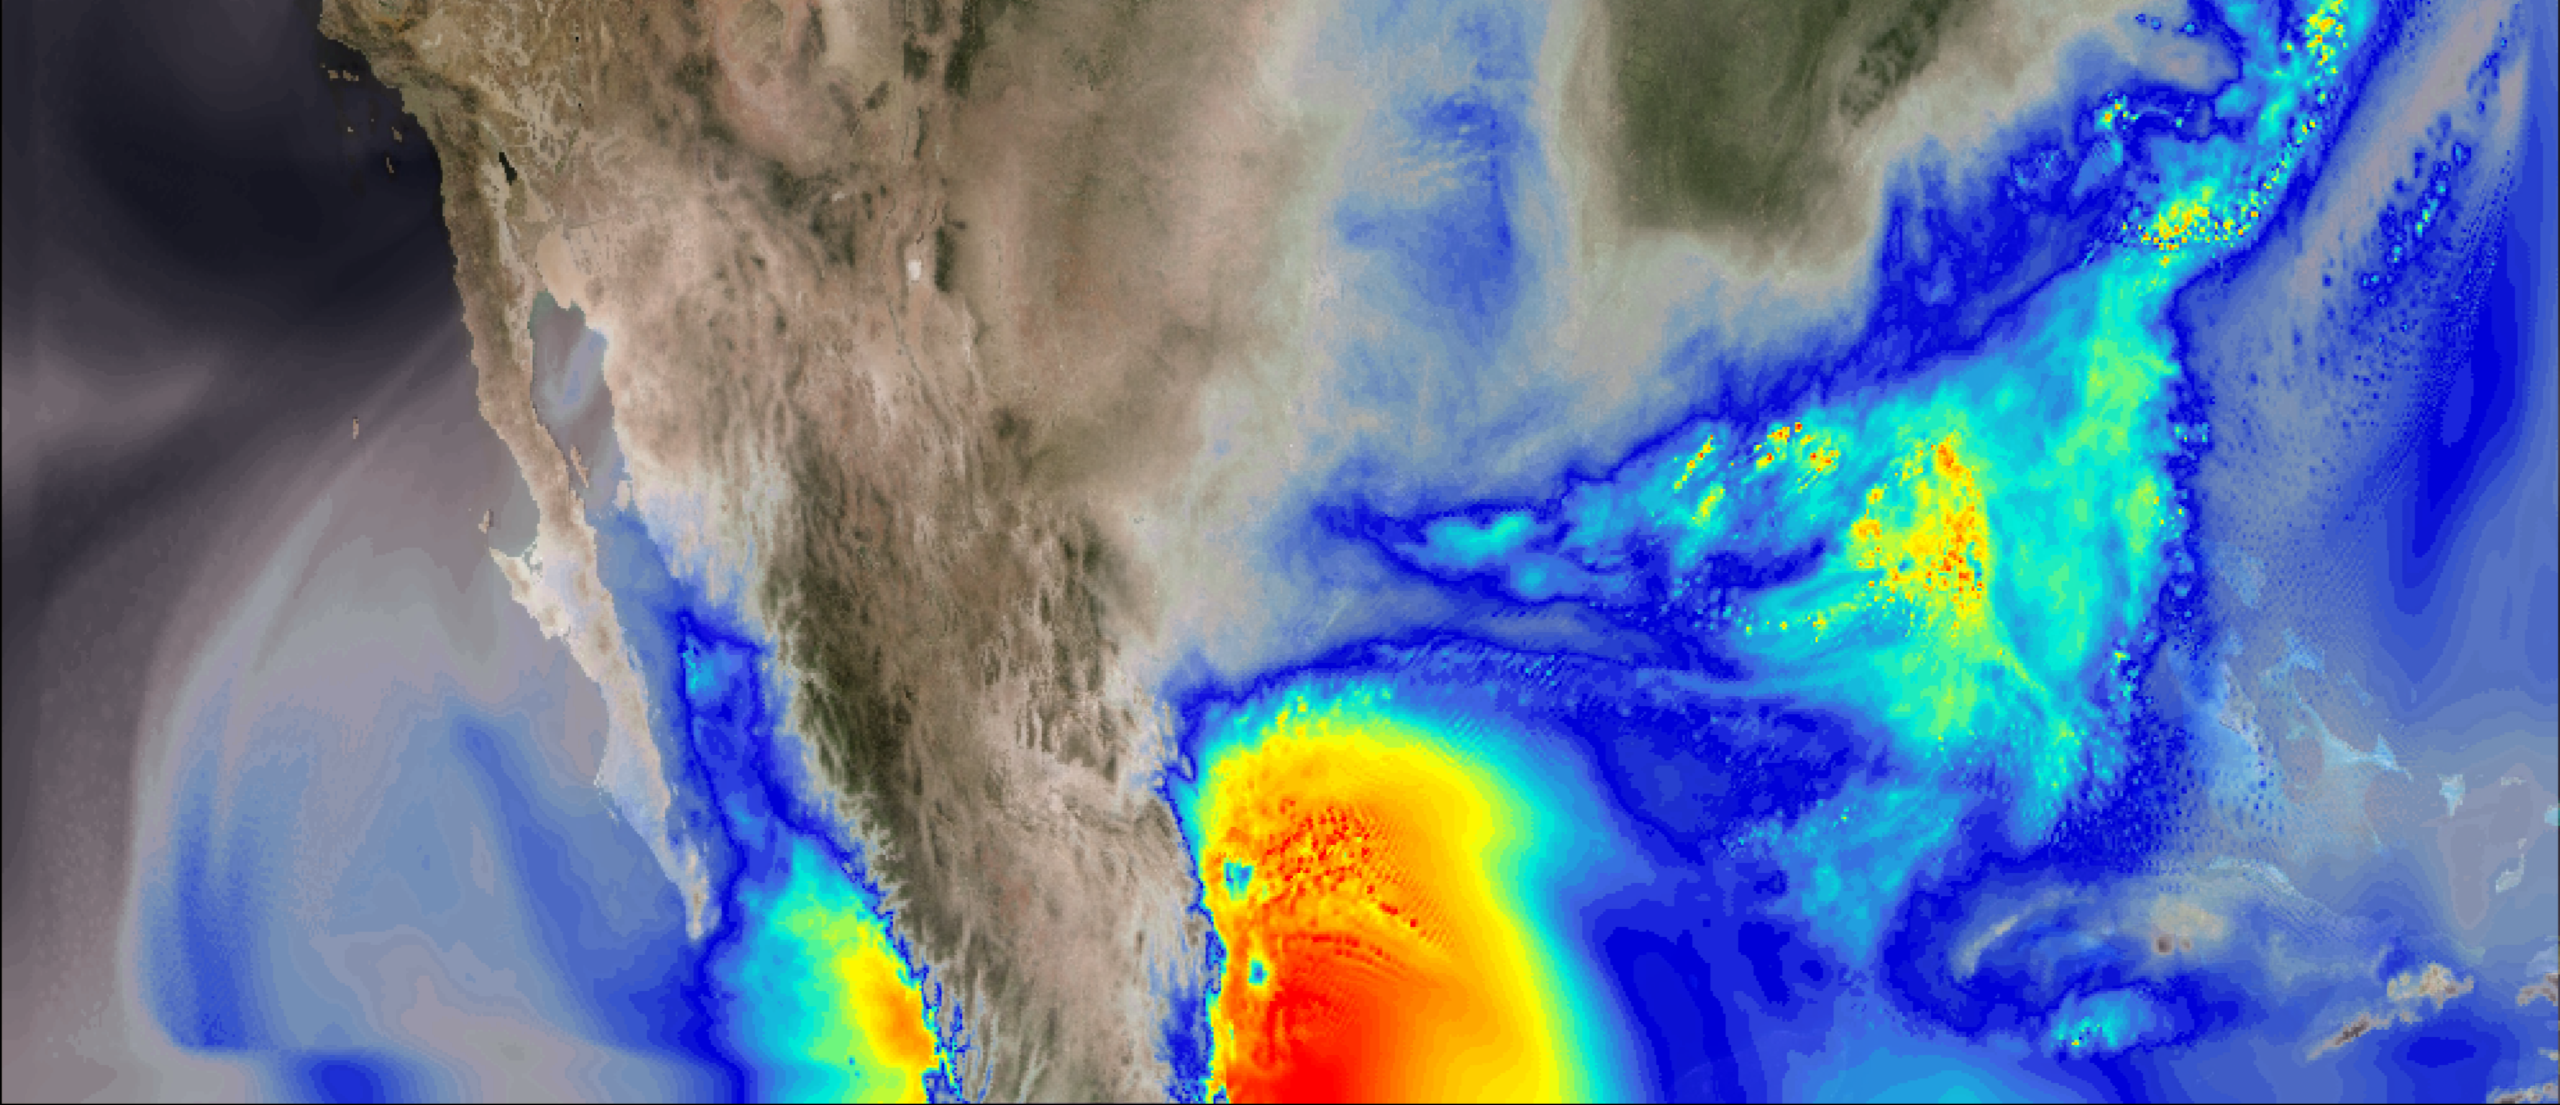
This visualization shows column integrated water vapor content over North America for the period April to June 2011, during which time one of the most destructive and deadliest tornado outbreaks to impact the United States occurred (April 25-28). Side-by-side comparison of the simulations show greater water vapor content in the simulated future climate, which can…
Read moreVisual Comparator
Visualizations enable us to detect patterns and trends in complex data sets, that might not be obvious by looking at the raw data alone. The visual exploration process often requires comparisons between multiple visualizations, either from the same dataset (E.g. different variables) or a different one, to identify relationships and compare patterns. The existing tools…
Read moreF5 Tornado in CM1
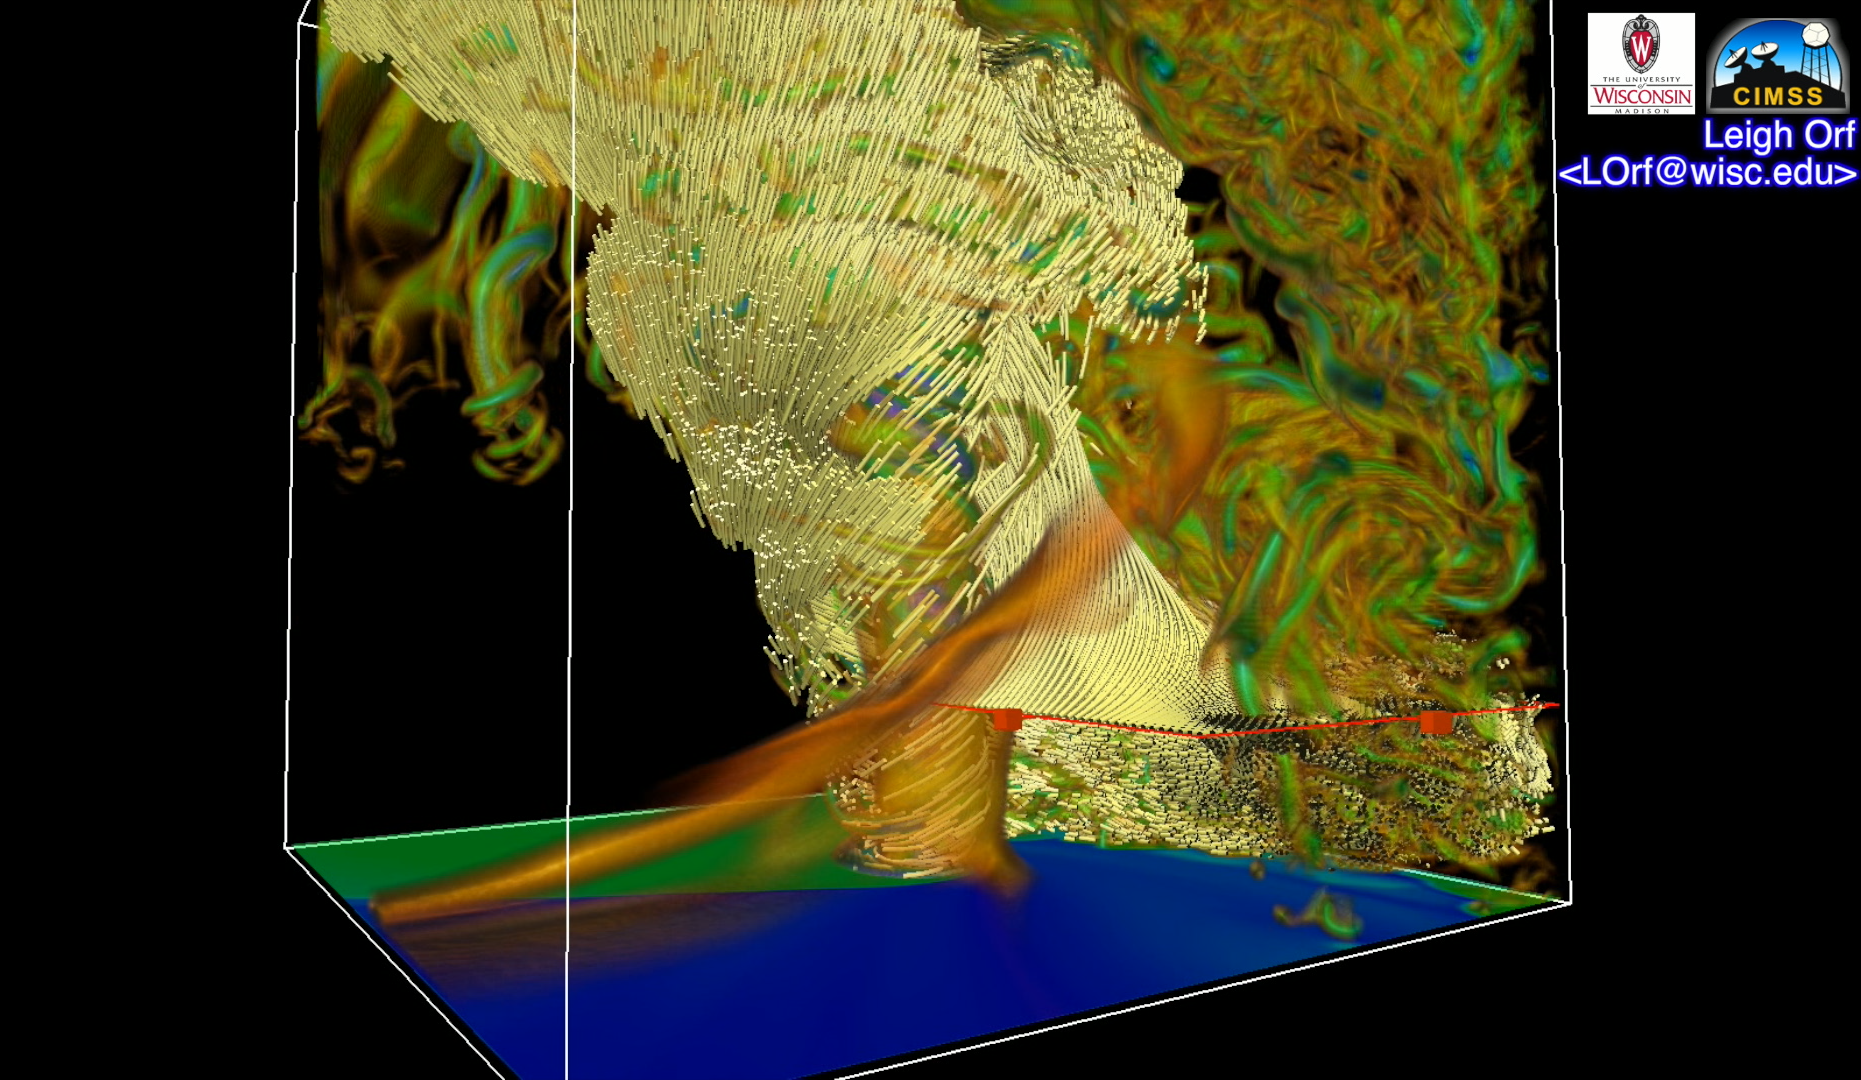
A simulation of an F5 tornado produced by Cloud Model 1 (CM1). Movies Quicktime Movie File (1920×1080, 2.57 GB) Images Science and Visualization Credits Leigh Orf, University of Wisconsin Madison. Model CM1. Visualization Software VAPOR
Read more