
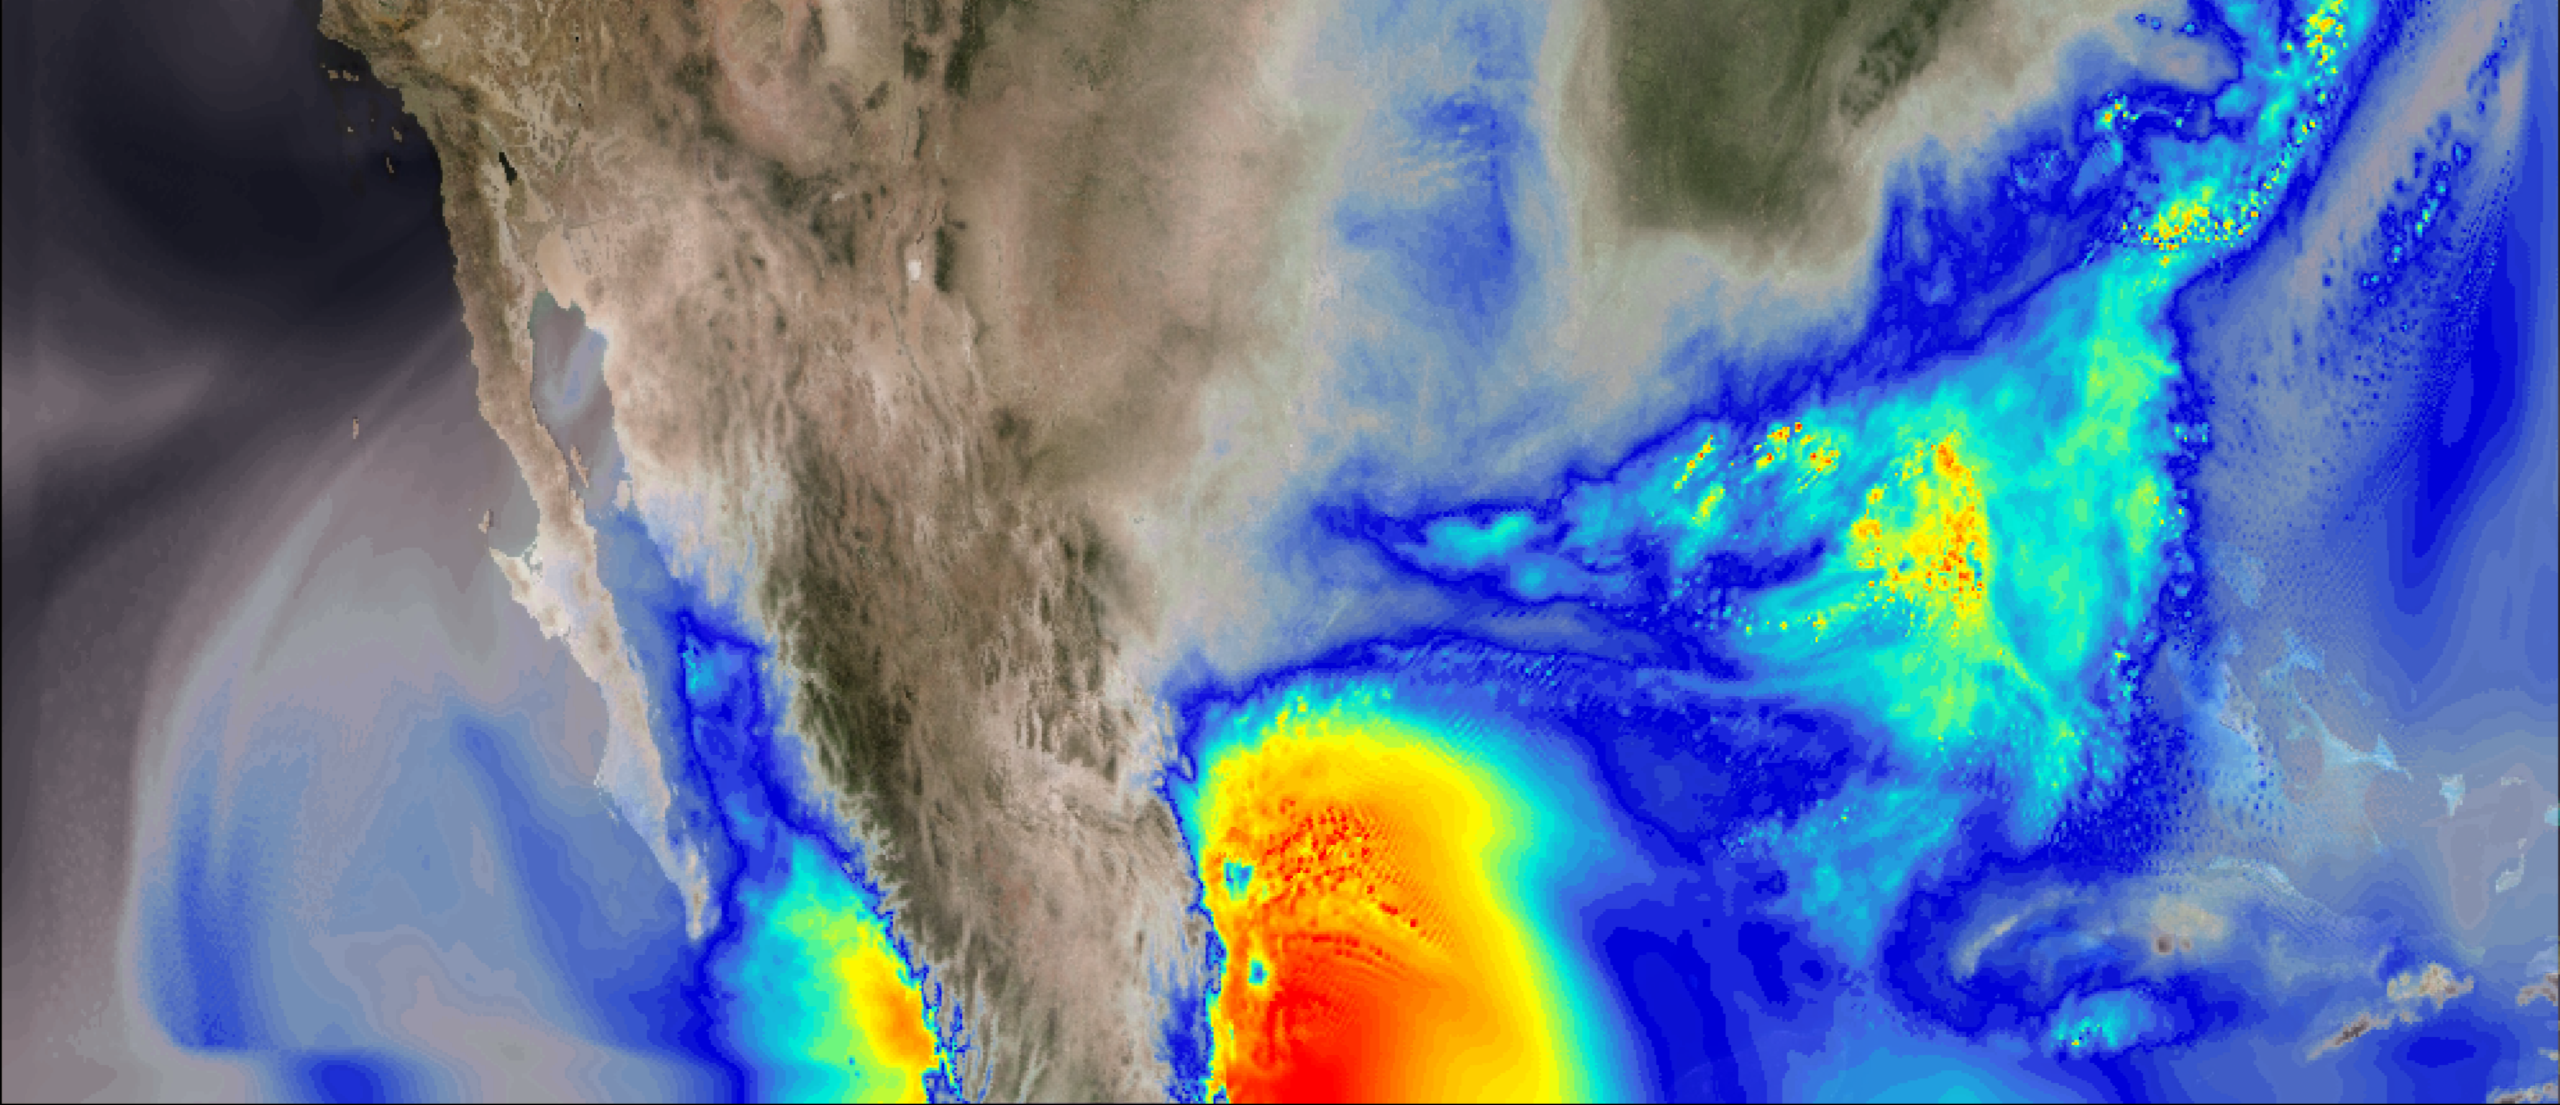
This visualization shows column integrated water vapor content over North America for the period April to June 2011, during which time one of the most destructive and deadliest tornado outbreaks to impact the United States occurred (April 25-28). Side-by-side comparison of the simulations show greater water vapor content in the simulated future climate, which can…
Read moreCategory: Water Vapor
Present and Future Climate in a Global Model
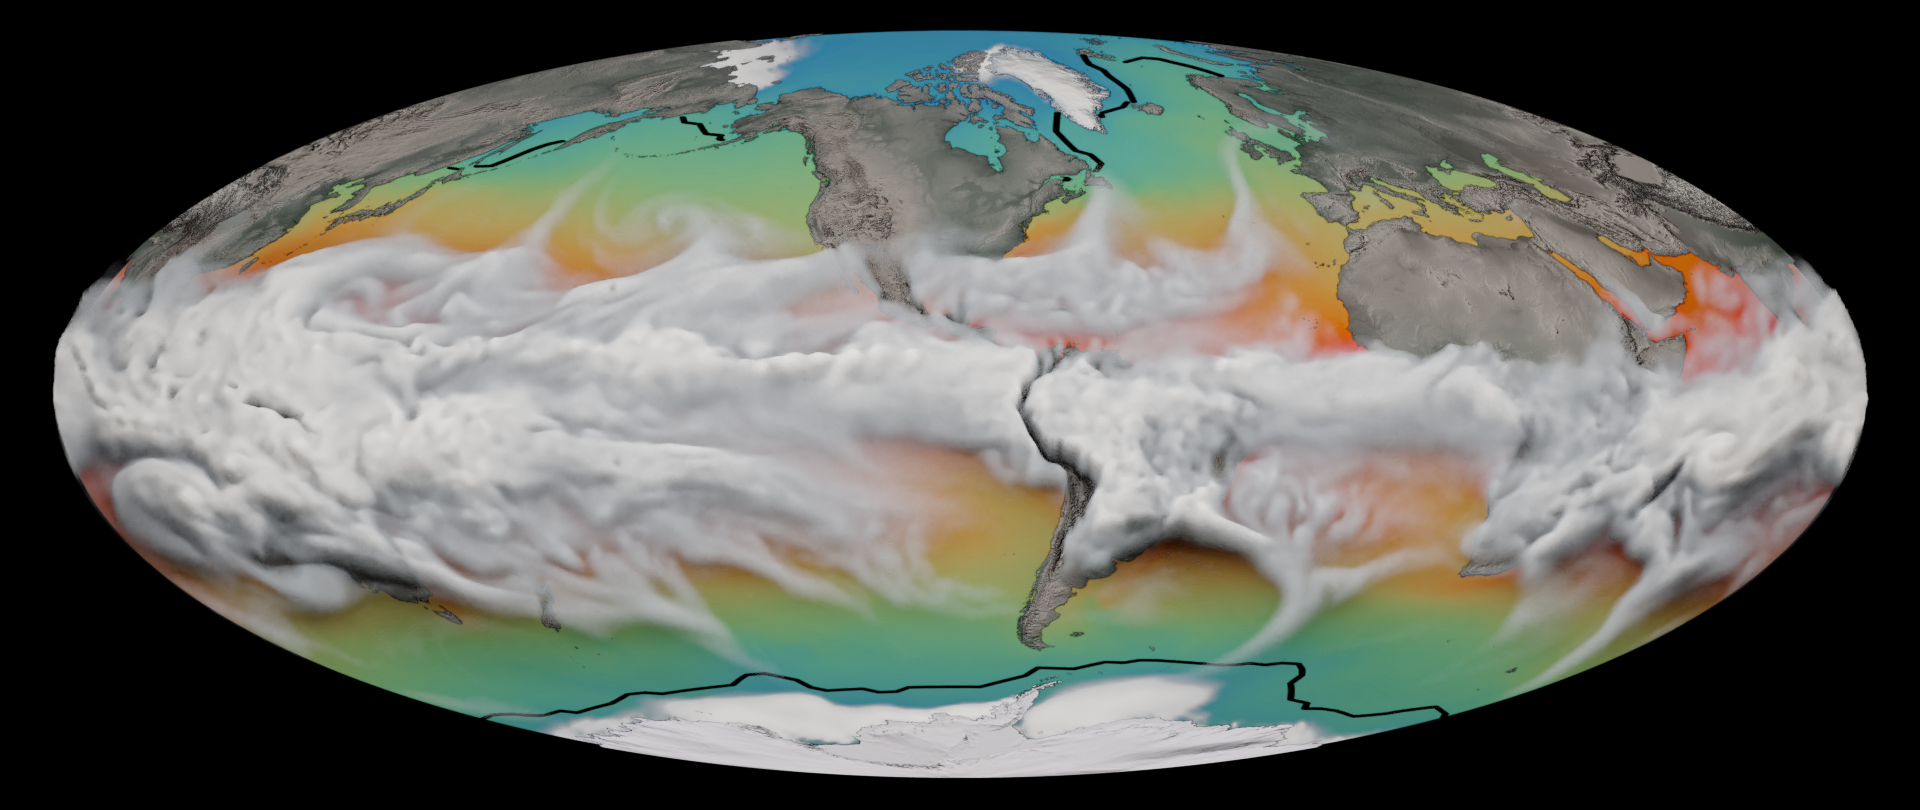
This visualization shows a CESM1 model comparison between a present day (1990) and a future (2090) simulation using a business-as-usual or high emissions scenario, called RCP8.5. Clouds represent six-hourly time steps of total water vapor for one year. Technically speaking, this is the CESM1 model variable, TMQ, defined as the total precipitable water (vertically integrated)…
Read moreClimate Change: Precipitation
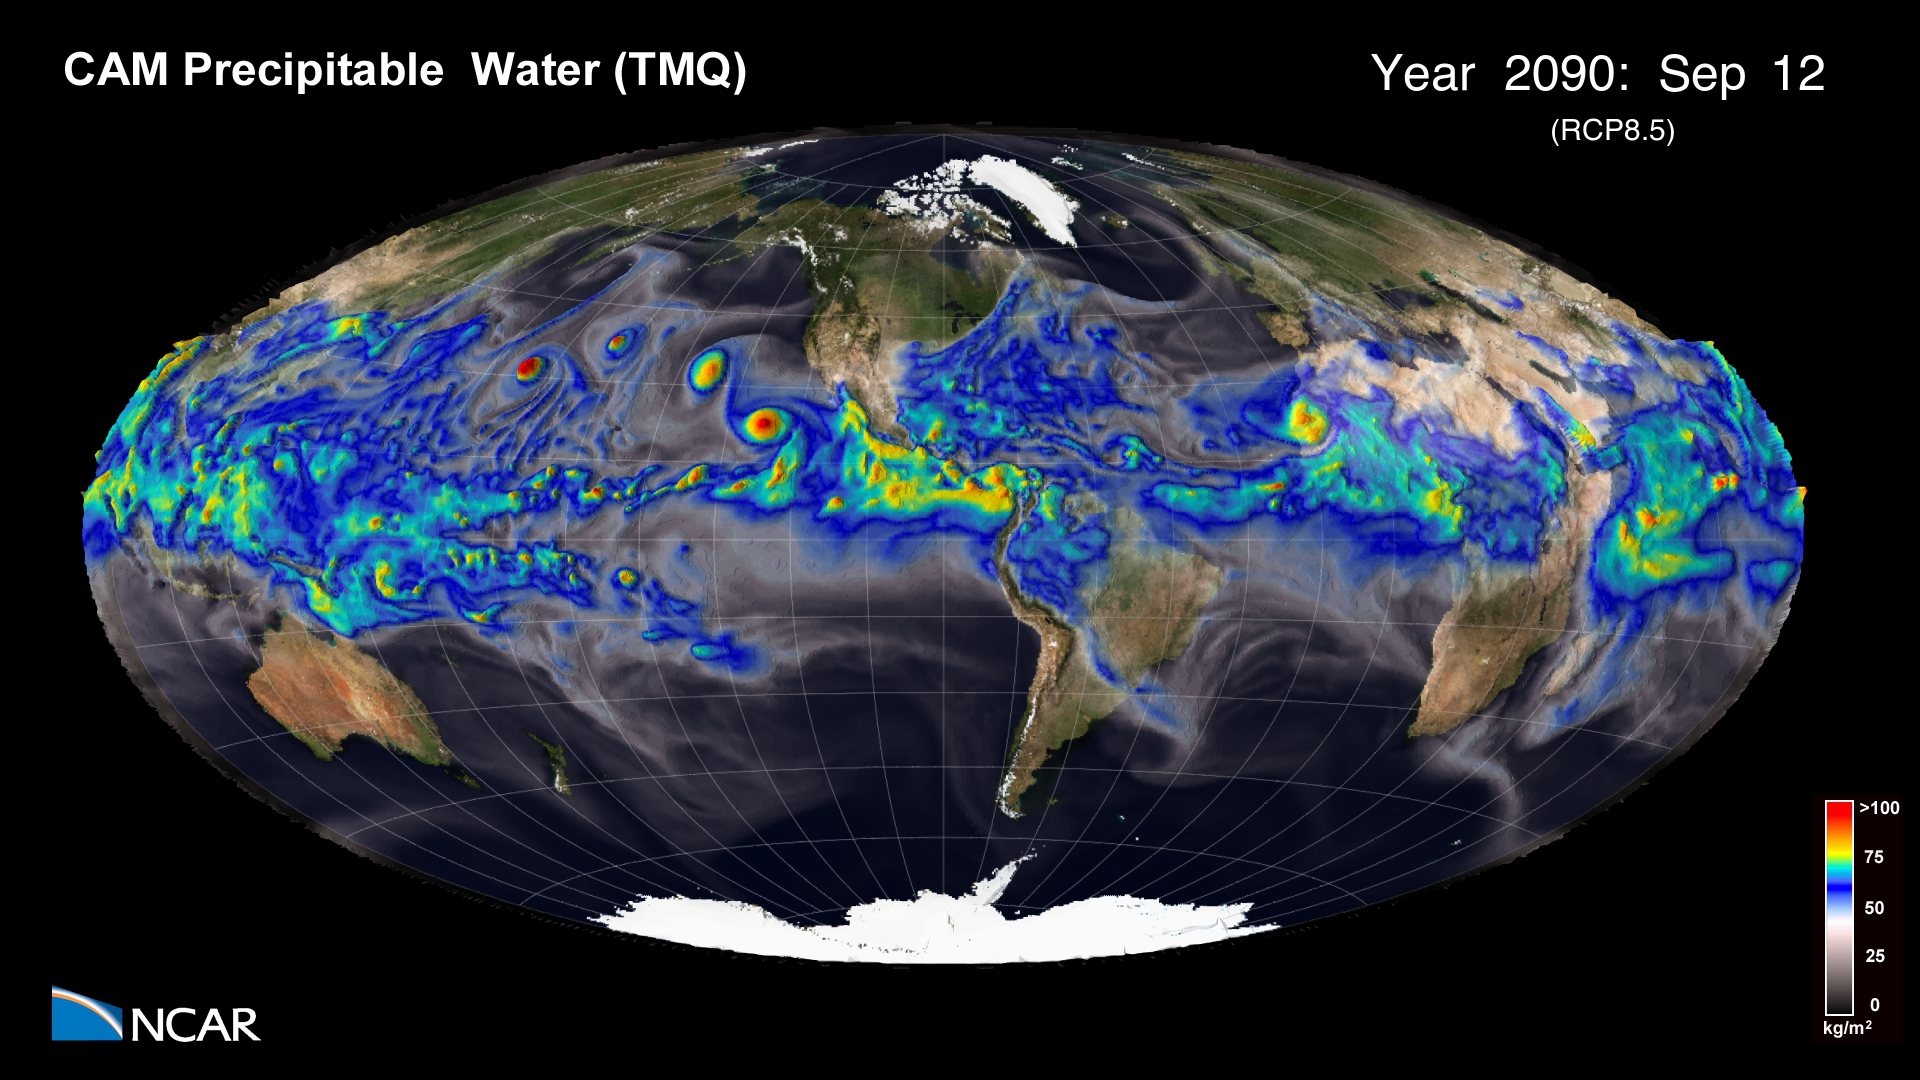
This simulation shows a comparison between present day (1990) and future (2090) precipitable water in the Earth’s atmosphere using an RCP8.5 emissions scenario. Movies Movie File (.mov, 1920×1080, 236MB) Images Science Credits This simulation was made possible because of the large number of individuals both from within NCAR and the many outside collaborators who have…
Read morePlanetary Water Vapor
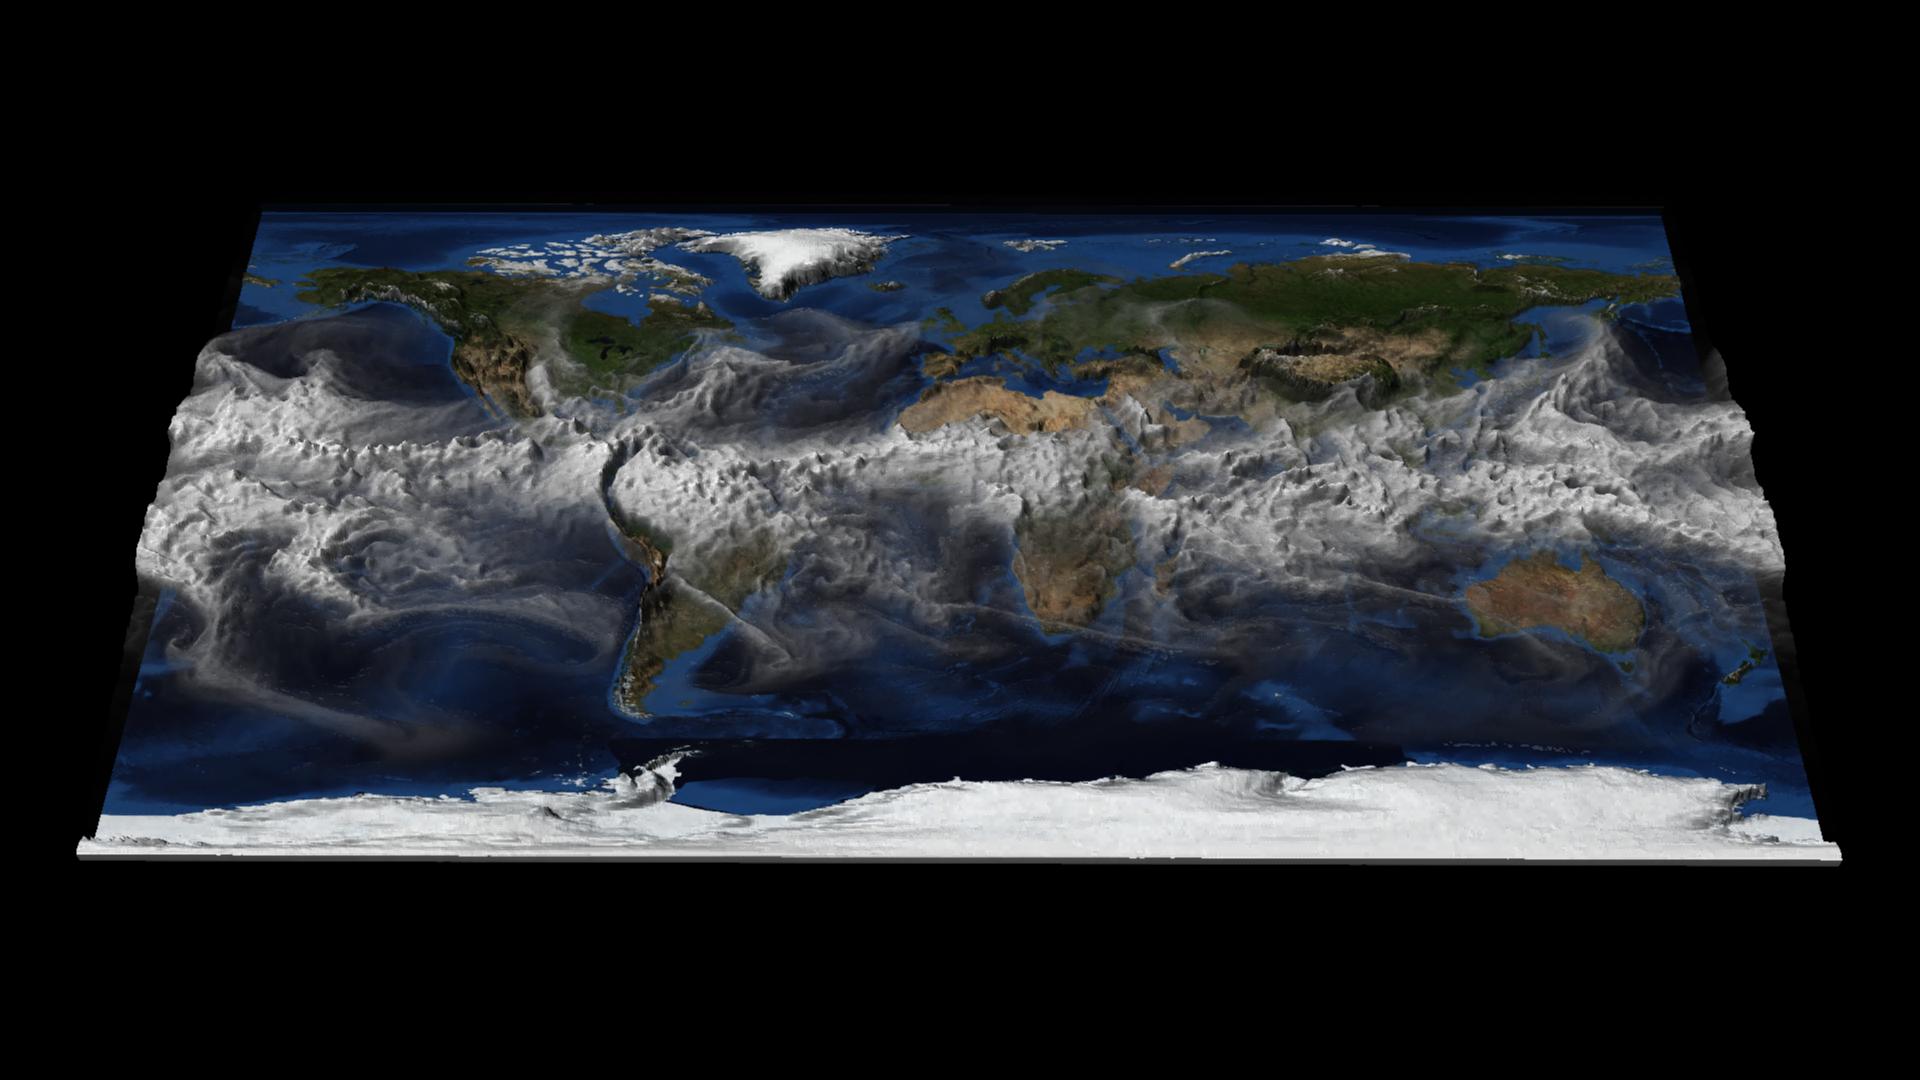
This visualization shows hourly time steps of CESM1 total column integrated water vapor (TMQ) for one year. The value of TMQ at each point determines the amount of 3D surface displacement. Higher values of TMQ have a larger displacement, helping to visually identify regions with the most significant temporal changes in water vapor. Movies Quicktime…
Read more