
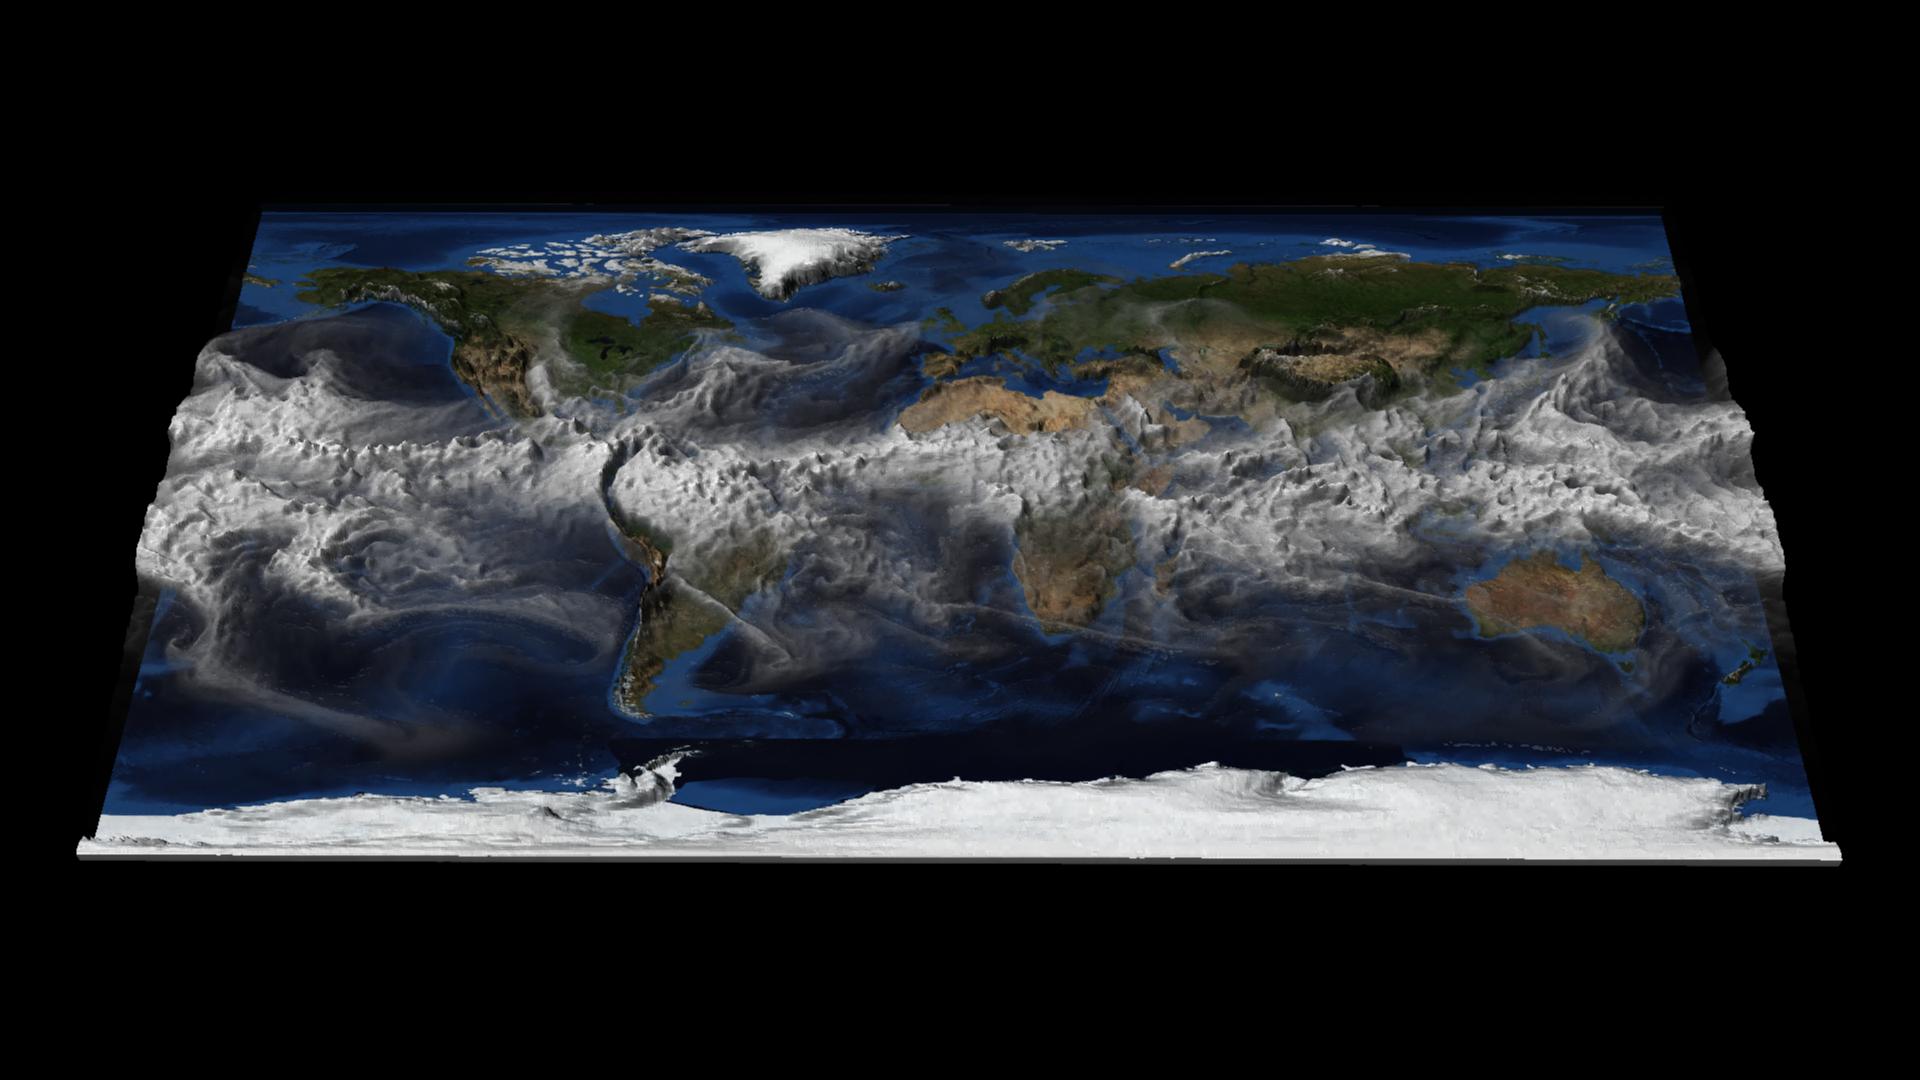
This visualization shows hourly time steps of CESM1 total column integrated water vapor (TMQ) for one year. The value of TMQ at each point determines the amount of 3D surface displacement. Higher values of TMQ have a larger displacement, helping to visually identify regions with the most significant temporal changes in water vapor.
Movies
Quicktime Version (January-December): 676MB, 1920×1080, 5m 11s
Images
Science Credits
Justin Small (NCAR/NESL)
This simulation was made possible because of the large number of individuals both from within NCAR and the many outside collaborators who have contributed to the CESM1 development and runs.
Computational Resources
This research was enabled by NCAR’s Computational and Information Systems Laboratory (CISL) compute and storage resources, including Yellowstone, a 1.5-petaflops IBM iDataPlex supercomputer with 72,288 processor cores.
Visualization and Post-production
Tim Scheitlin and Perry Domingo (NCAR/CISL)
Model
The Community Earth System Model (CESM) is a fully-coupled, global climate model that provides state-of-the-art computer simulations of the Earth’s past, present, and future climate states.
CESM is sponsored by the National Science Foundation (NSF) and the U.S. Department of Energy (DOE). Administration of the CESM is maintained by the Climate and Global Dynamics Division (CGD) at the National Center for Atmospheric Research (NCAR).
This simulation has .25 degree resolution in the atmosphere and land, and 0.1 degree resolution in ocean and ice.
Visualization Software
Visualization Software: The NCAR Command Language (Version 6.1.1) [Software]. (2013). Boulder, Colorado: UCAR/NCAR/CISL/VETS. http://dx.doi.org/10.5065/D6WD3XH5
Acknowledgments
NCAR-Wyoming Supercomputng Center (NWSC) University of Wyoming