
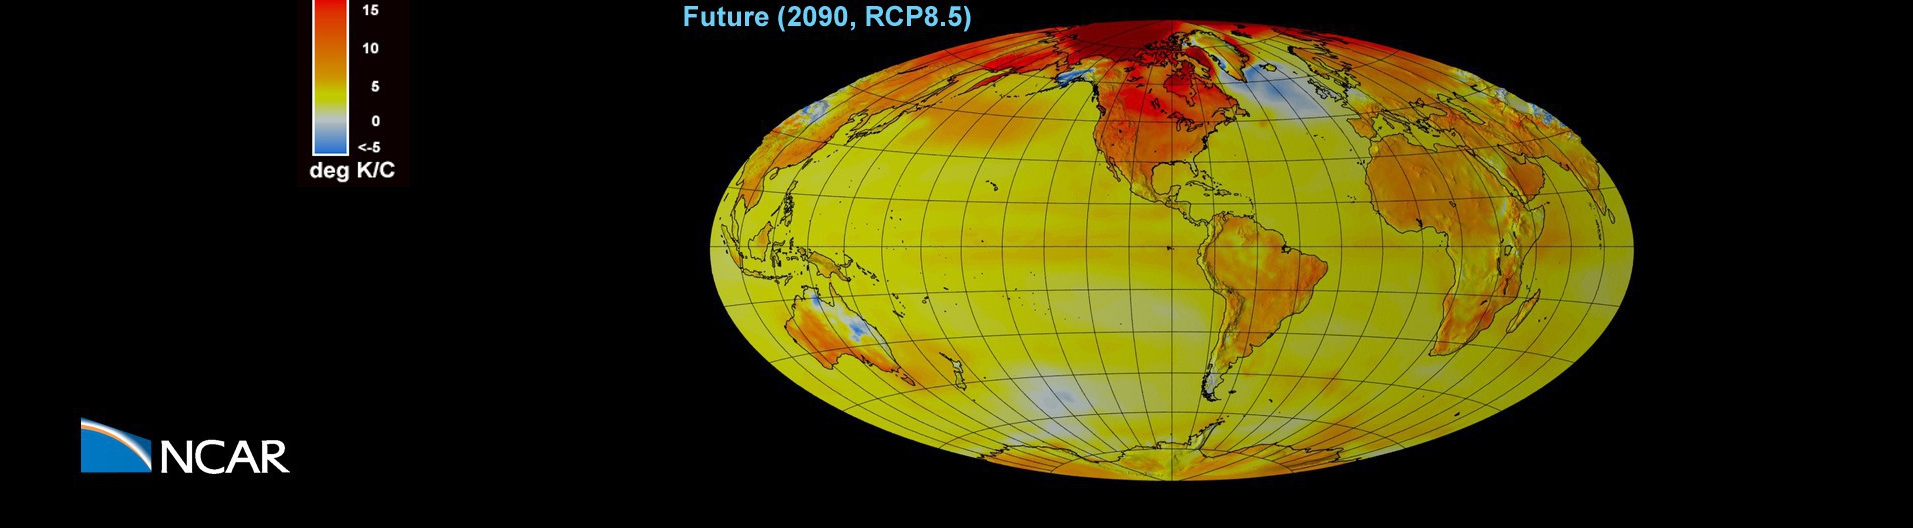
A comparison between present and future (RCP8.5) surface temperature anomalies. A 3-day smoothing has been applied to the output to dampen day to day variability. Movies Movie File (.mov, 118MB, 1920×1080) Images Computational Modeling Nan Rosenbloom and Gary Strand (NCAR/CGD) Visualization and Post-production Tim Scheitlin and Matt Rehme (NCAR/CISL) Model CESM Visualization Software NCAR Command…
Read moreCategory: Temperature Anomalies
Negative NAO Triggered by Stratospheric Sudden Warming
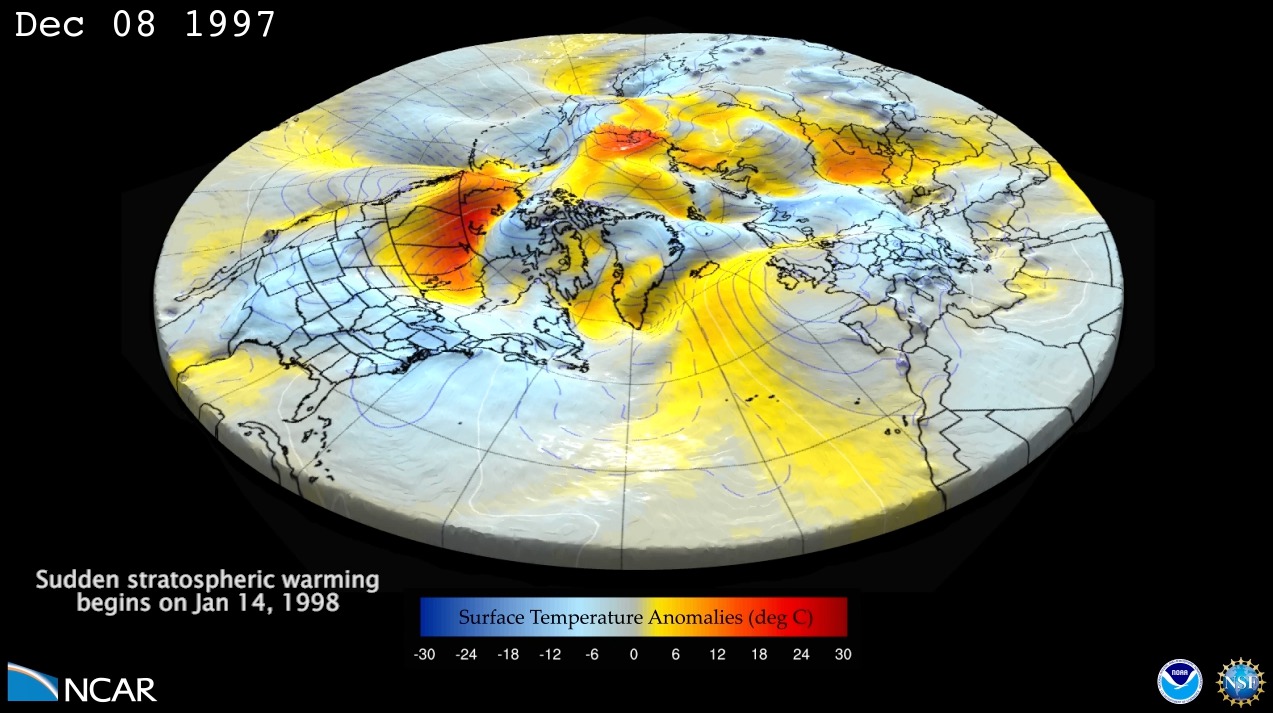
Seasonal forecast for winter of 1997/1998 with 46LCAM (Ensemble member with a sudden stratospheric warming). This is a 4 month forecast of surface geopotential height anomalies (shown with surface relief and contour lines) and surface temperature anomalies (shown with a color gradient). The forecast starts on Dec 1, 1997, and goes through the end of…
Read moreSurface Temperatures from Climate Change vs. Geoengineering
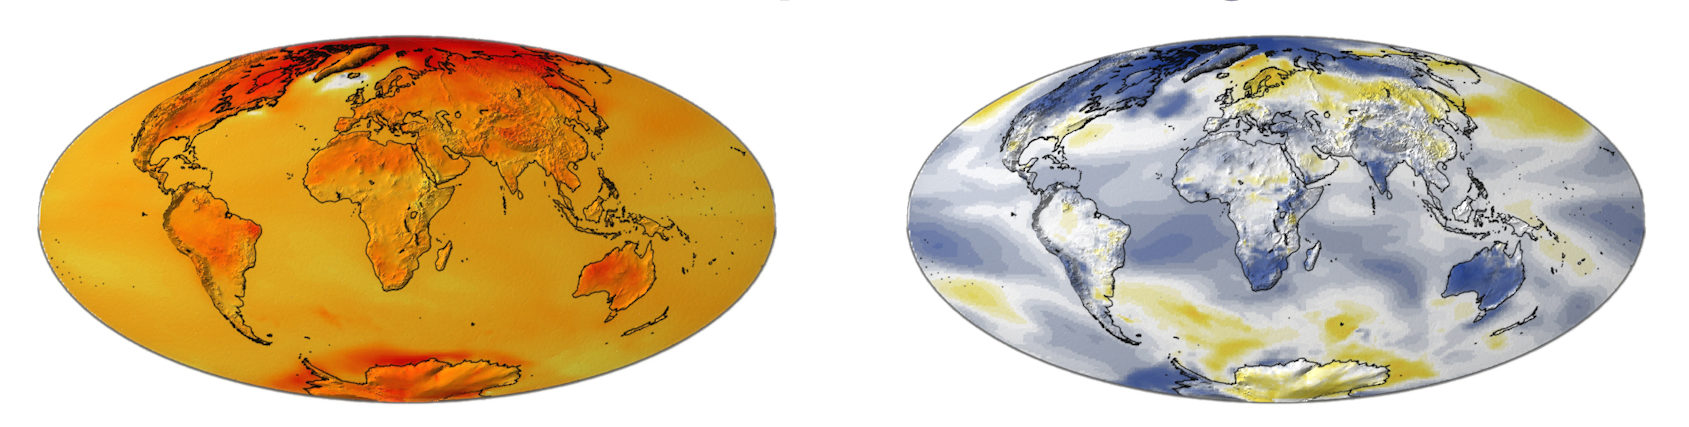
This visualization describes temperature changes relative to years 2015-2024 from unabated climate change (RCP8.5) and stratospheric sulfate aerosol geoengineering (using feedback) simulated by a state-of-the-art coupled earth system model. Geoengineering, often using stratospheric sulfate aerosols, is discussed as a potential means of deliberately offsetting some of the effects of climate change, such as rising temperatures.…
Read more