
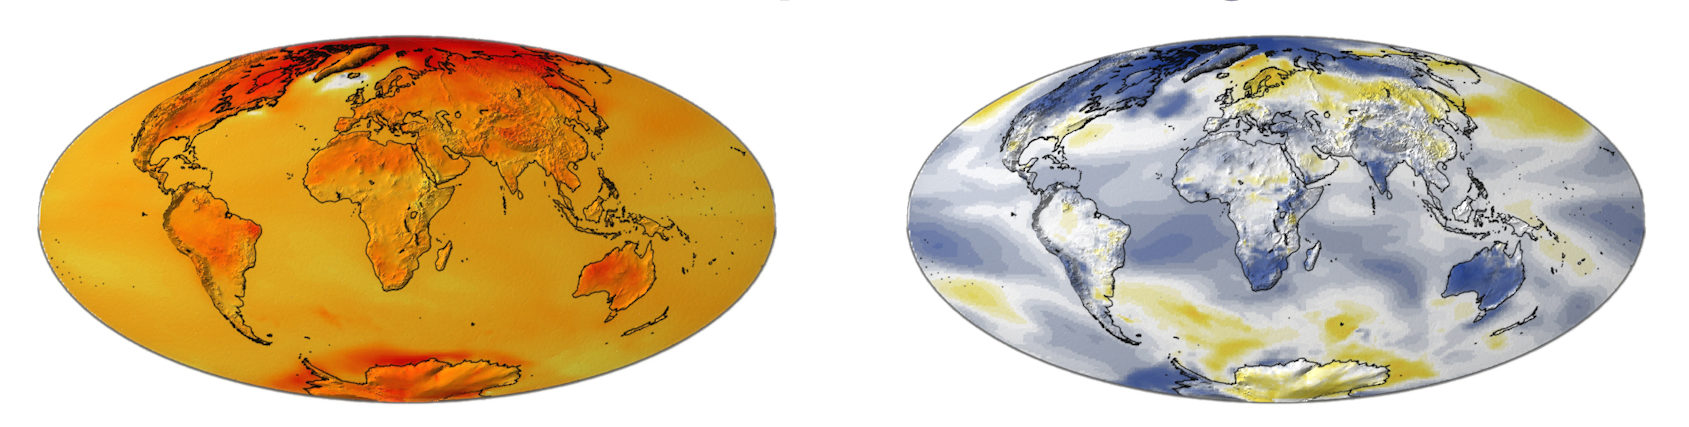
This visualization describes temperature changes relative to years 2015-2024 from unabated climate change (RCP8.5) and stratospheric sulfate aerosol geoengineering (using feedback) simulated by a state-of-the-art coupled earth system model. Geoengineering, often using stratospheric sulfate aerosols, is discussed as a potential means of deliberately offsetting some of the effects of climate change, such as rising temperatures.…
Read moreCategory: Visualization Software
Modelling The Indonesian Throughflow
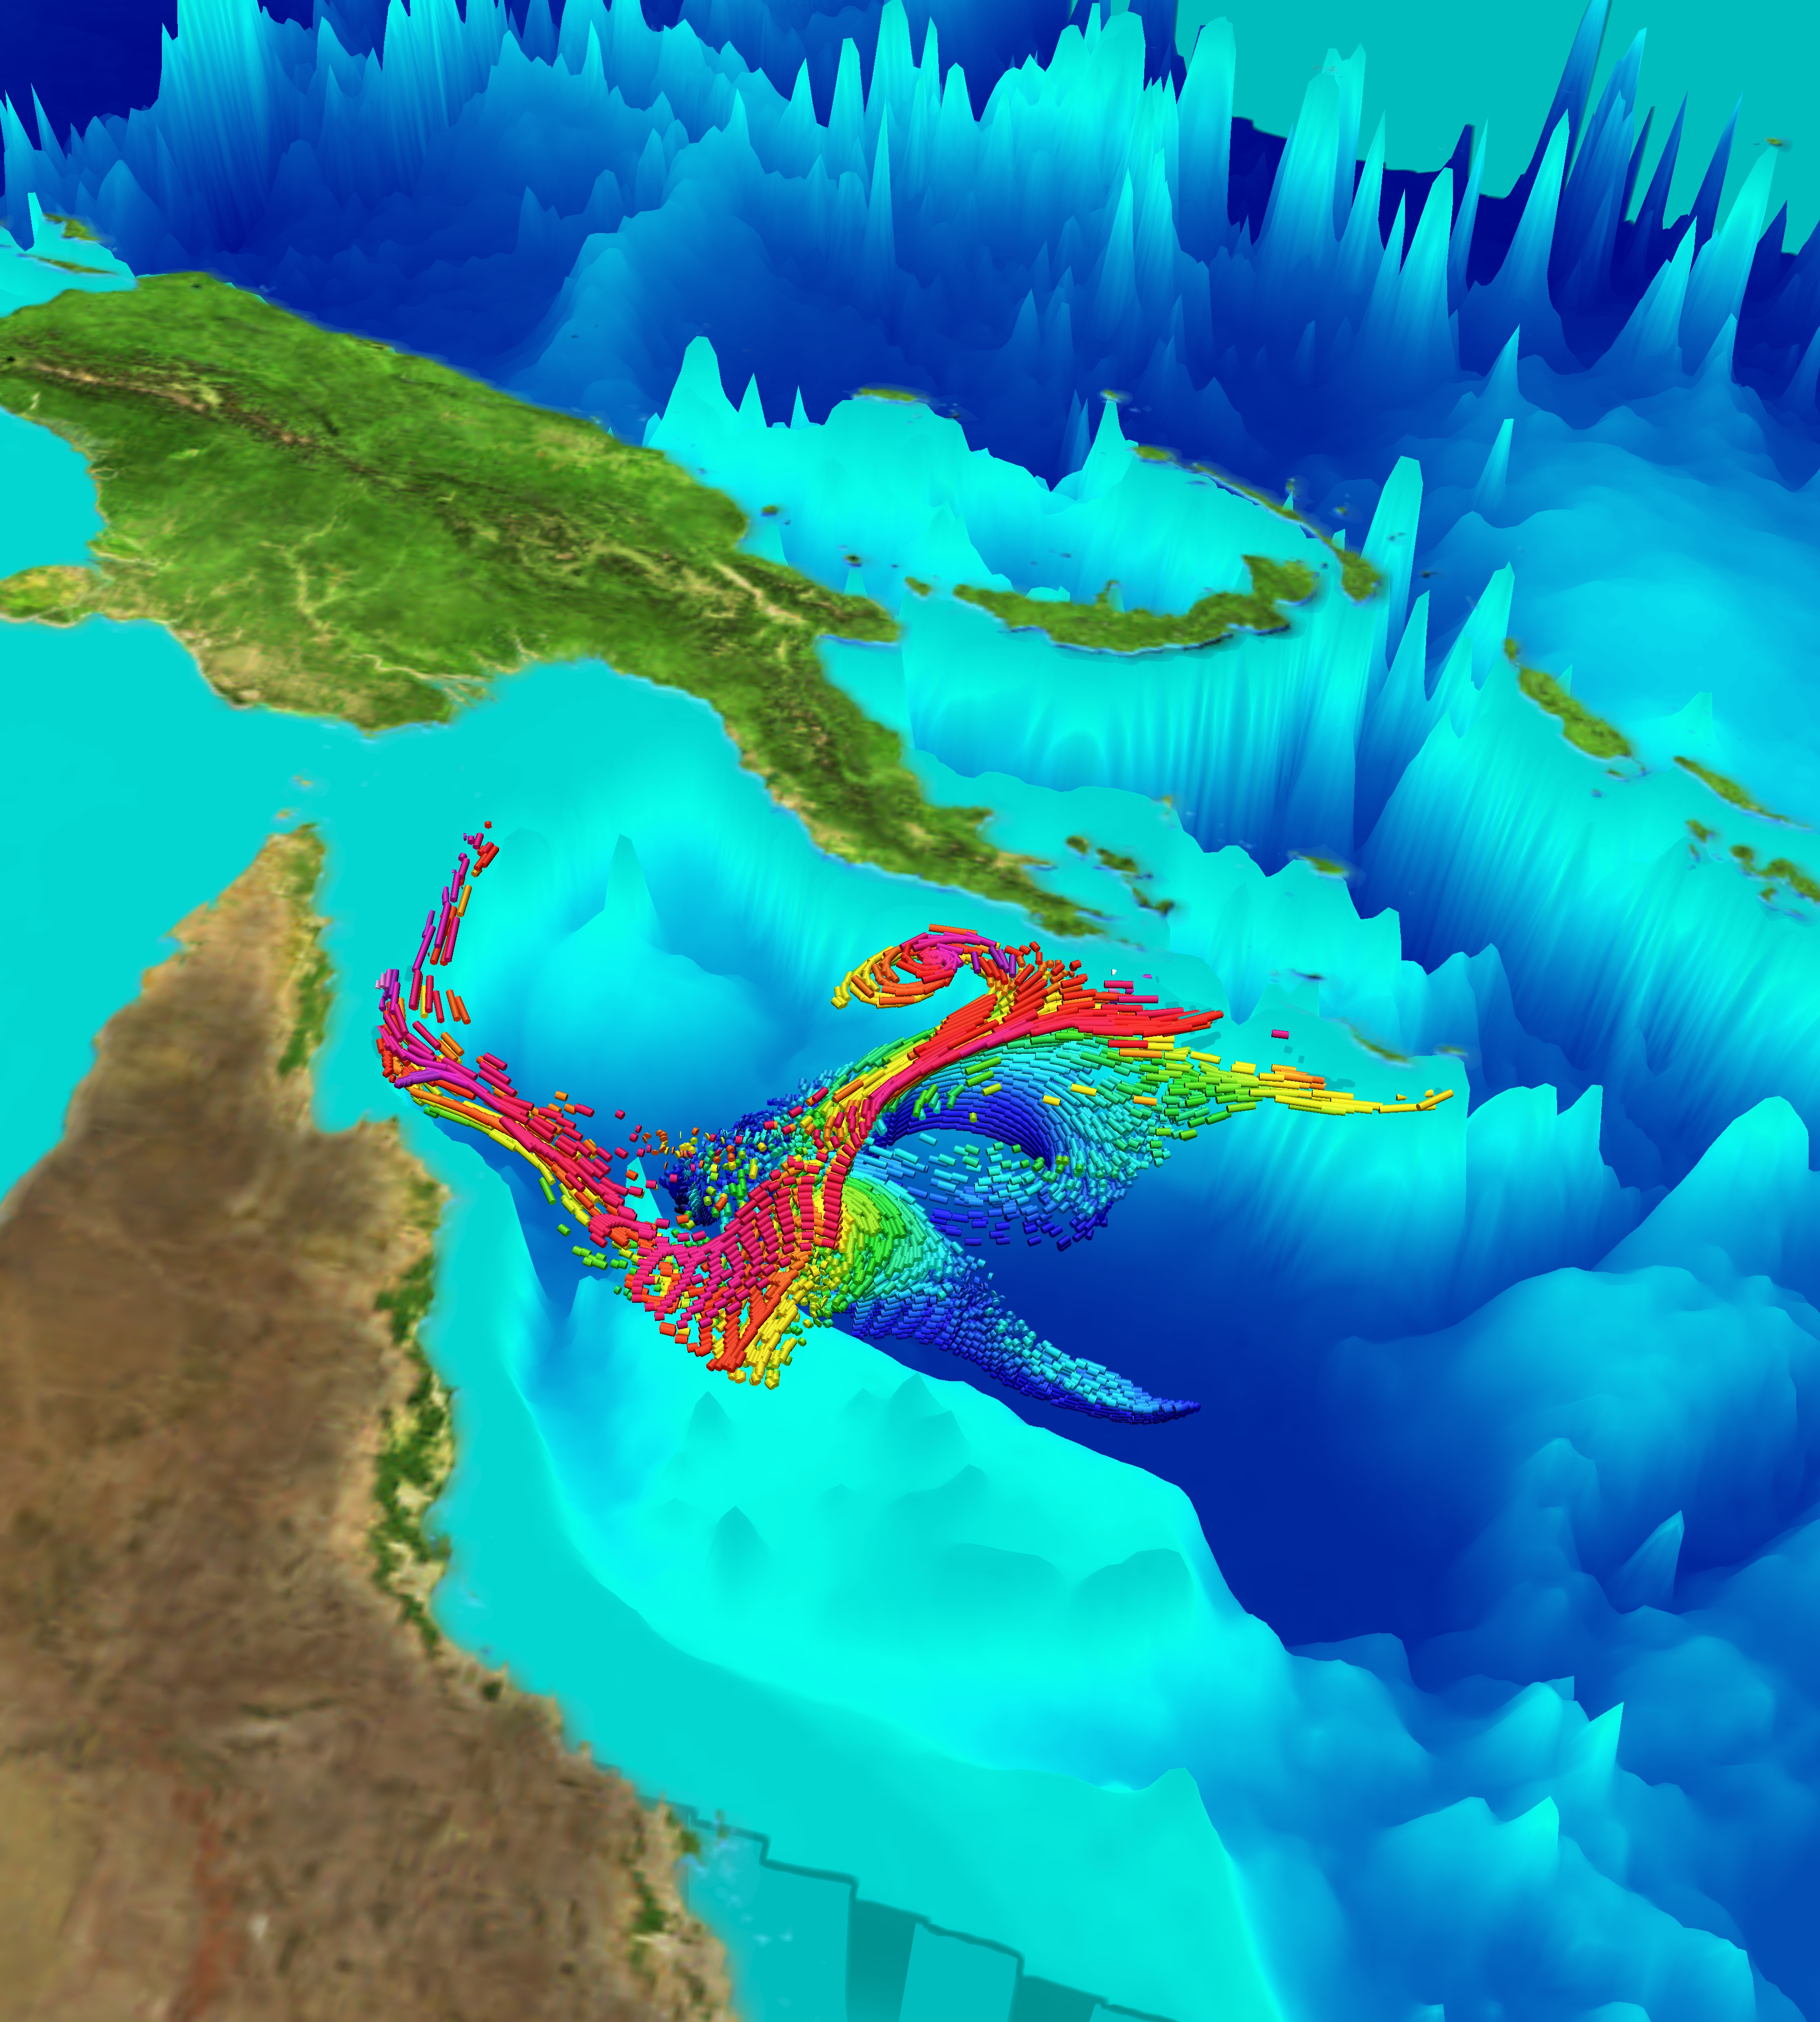
Rising ocean temperatures have given rise to coral bleaching events at higher rates than have been seen in observed history. Researchers at the National Center for Atmospheric Research are studying how effectively coral reef ecosystems can repopulate each other after bleaching events through a metric called Potential Connectivity. In this visualization, we observe a state…
Read moreYarnell Hill Fire
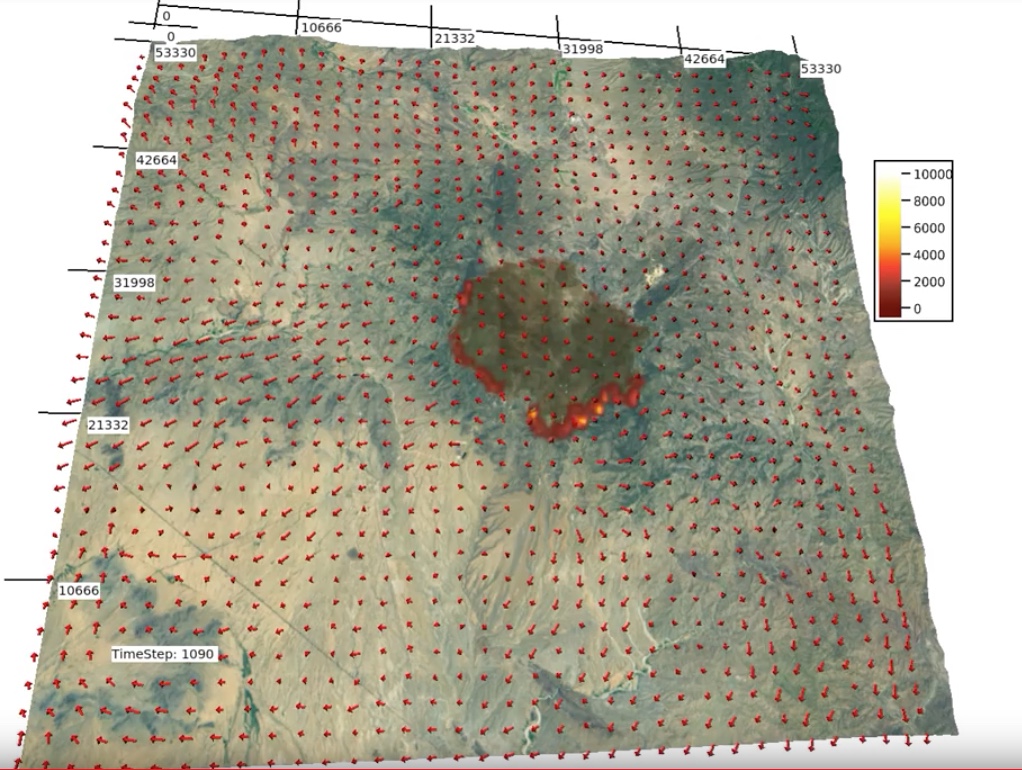
Ignition: 6/28/13 near Yarnell, Arizona Movies Images Science Credits Principle Investigator: Janice Cohen (NCAR) Collaborator: Wilfrid Schroeder (Univ. of Maryland) Visualization Software VAPOR
Read moreKing Fire 2014
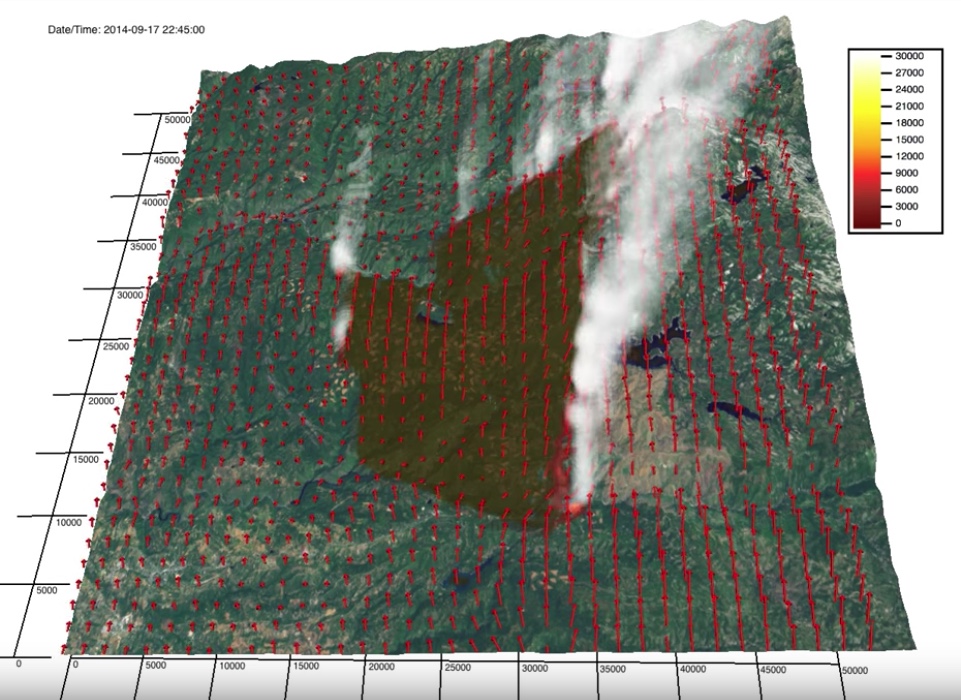
The King Fire was ignited on 9/13/14 in the Eldorado National Forest northeast of Pollock Pines, CA, where pine plantations lie between steep canyons. Eventhough fuel conditions were dry, environmental winds recorded at nearby weather stations were weak, thus rapid fire growth was not expected. On the 17th, the north-spreading fire reached the Rubicon canyon…
Read morePlanetary Water Vapor
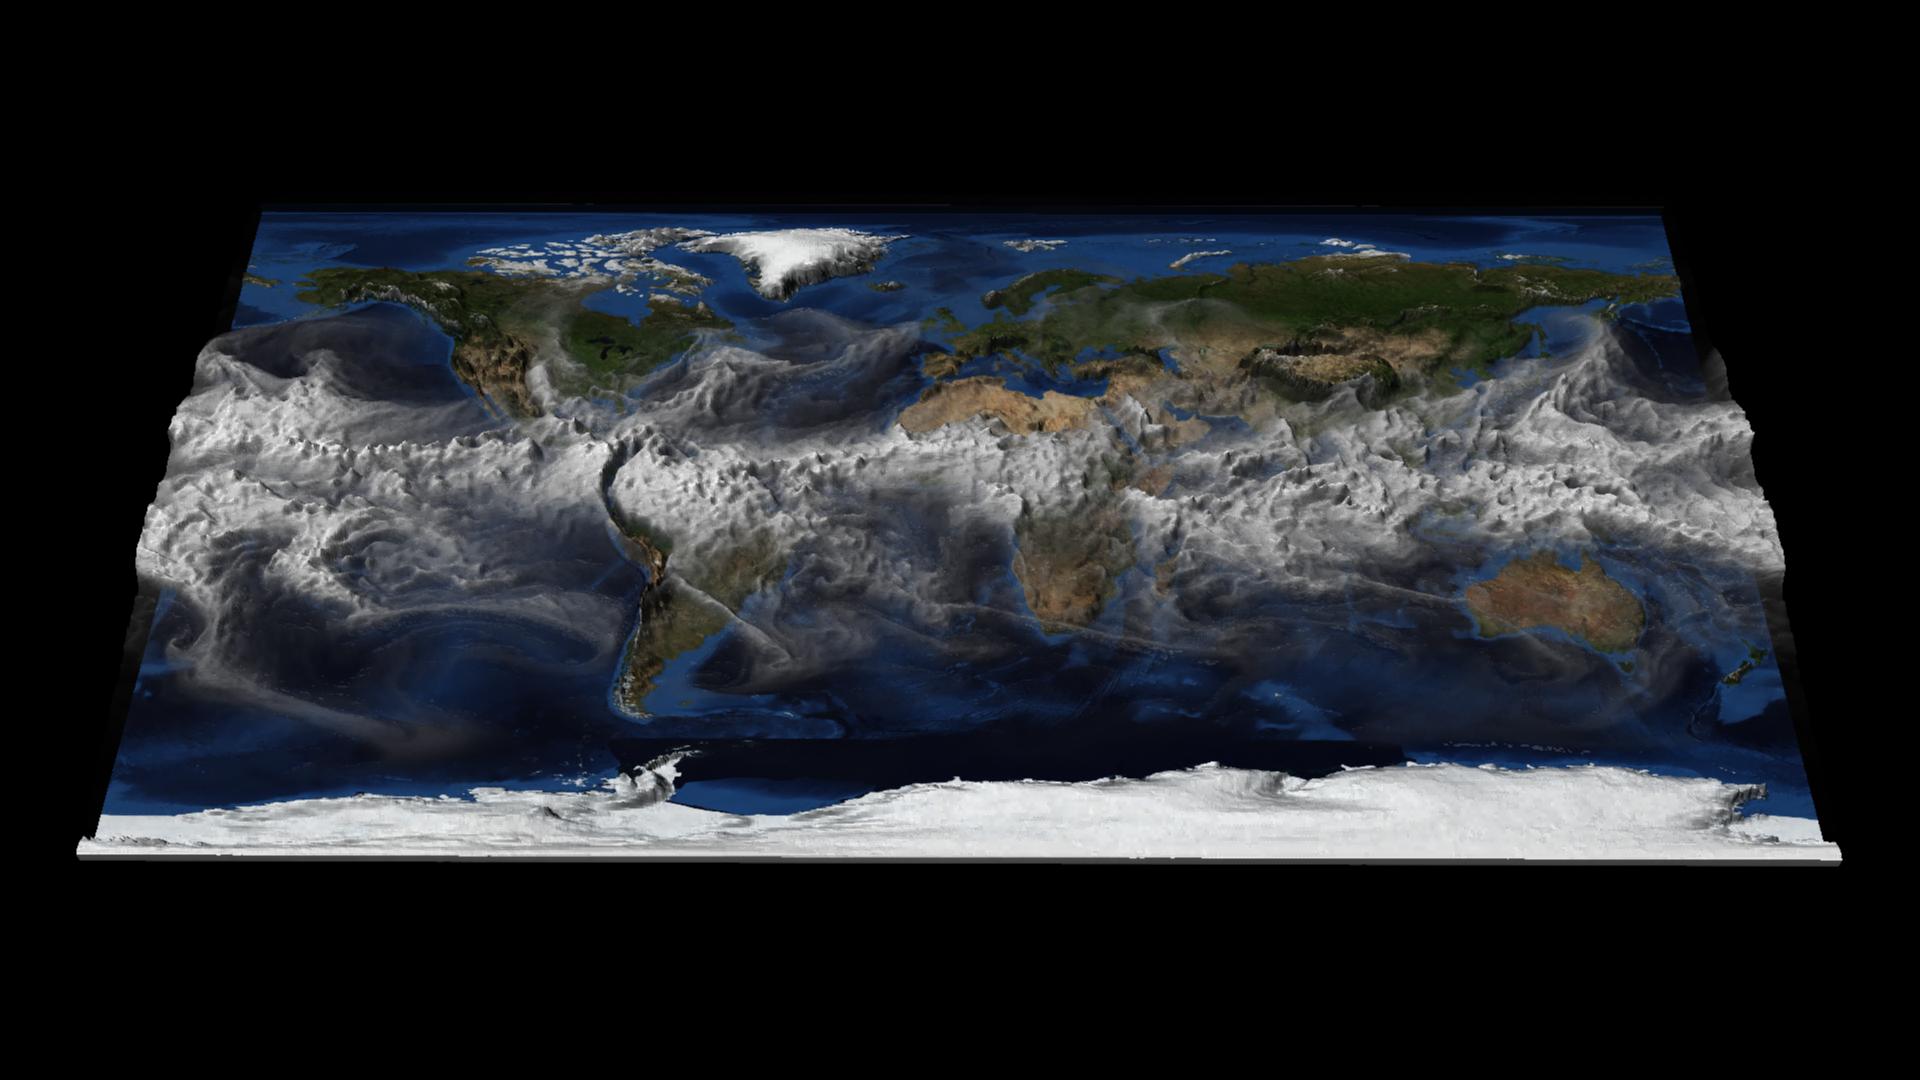
This visualization shows hourly time steps of CESM1 total column integrated water vapor (TMQ) for one year. The value of TMQ at each point determines the amount of 3D surface displacement. Higher values of TMQ have a larger displacement, helping to visually identify regions with the most significant temporal changes in water vapor. Movies Quicktime…
Read moreChino Hills Earthquake
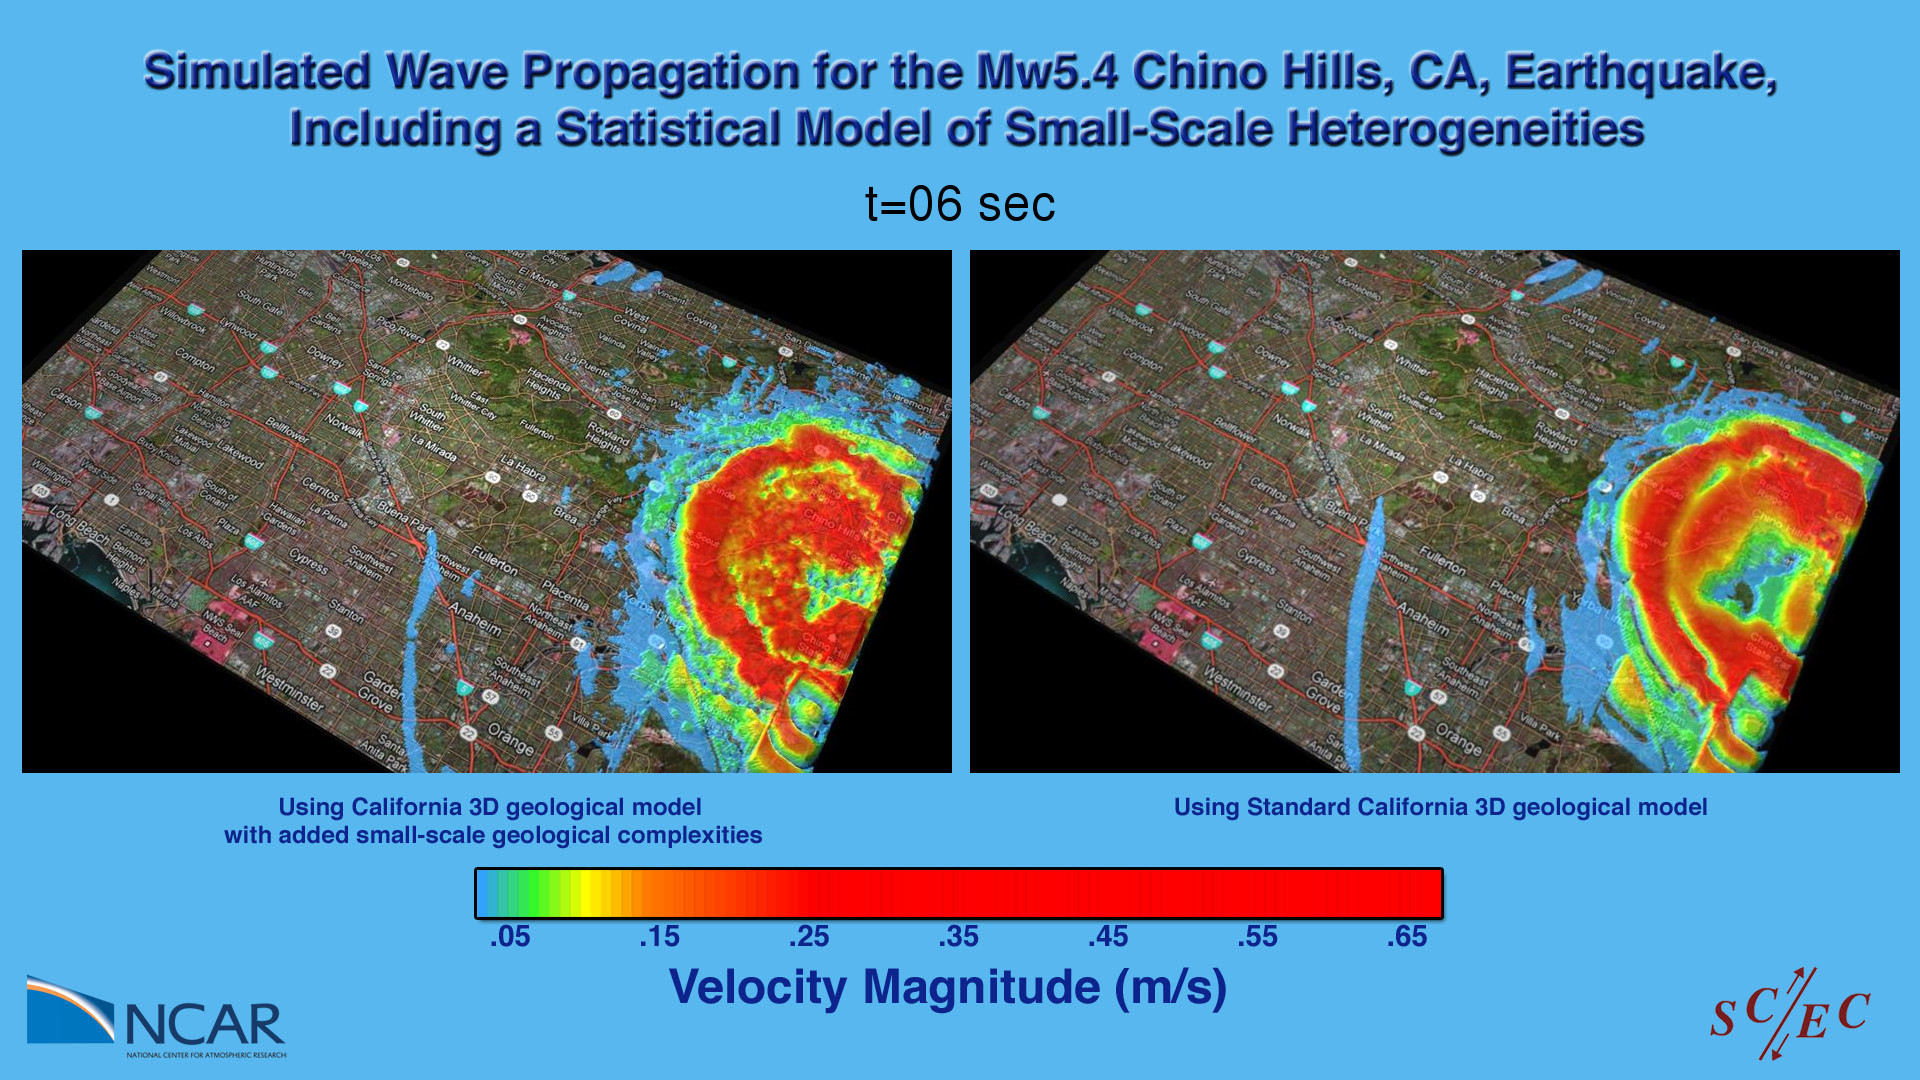
Southern California Earthquake Center (SCEC) researchers are working to improve ground motion simulations for California by developing more realistic small-scale models of the earth’s near-surface structure. The two animations shown in this visualization compare simulation results showing peak ground velocities at the earth’s surface for the M5.4 Chino Hills California earthquake. For the two simulations…
Read moreSunspots
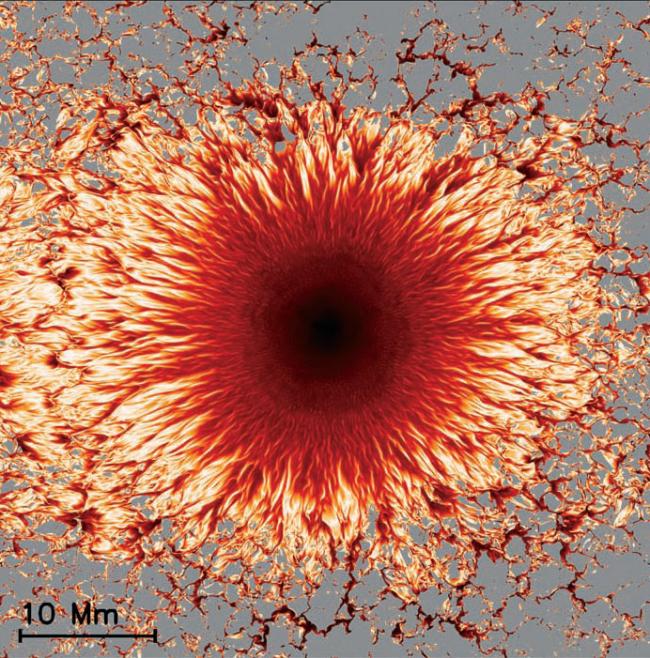
Transition from umbra to penumbra shows changes in magnetic field. The interface between a sunspot’s umbra (dark center) and penumbra (lighter outer region) shows a complex structure with narrow, almost horizontal (lighter to white) filaments embedded in a background having a more vertical (darker to black) magnetic field. Farther out, extended patches of horizontal field…
Read moreNCAR’s Wind Forecast Improvement Project 2
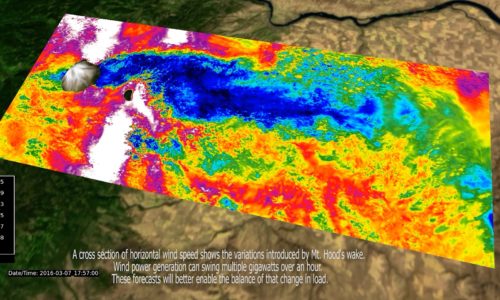
By the end of 2016, the state of Oregon had an installed wind generating power capacity of over 3 Gigawatts. Wind power, while clean and renewable, requires constant load balancing due to variable weather conditions. These conditions must be met with state of the art forecasting methods in order to maximize load balancing efficiency. New…
Read more