
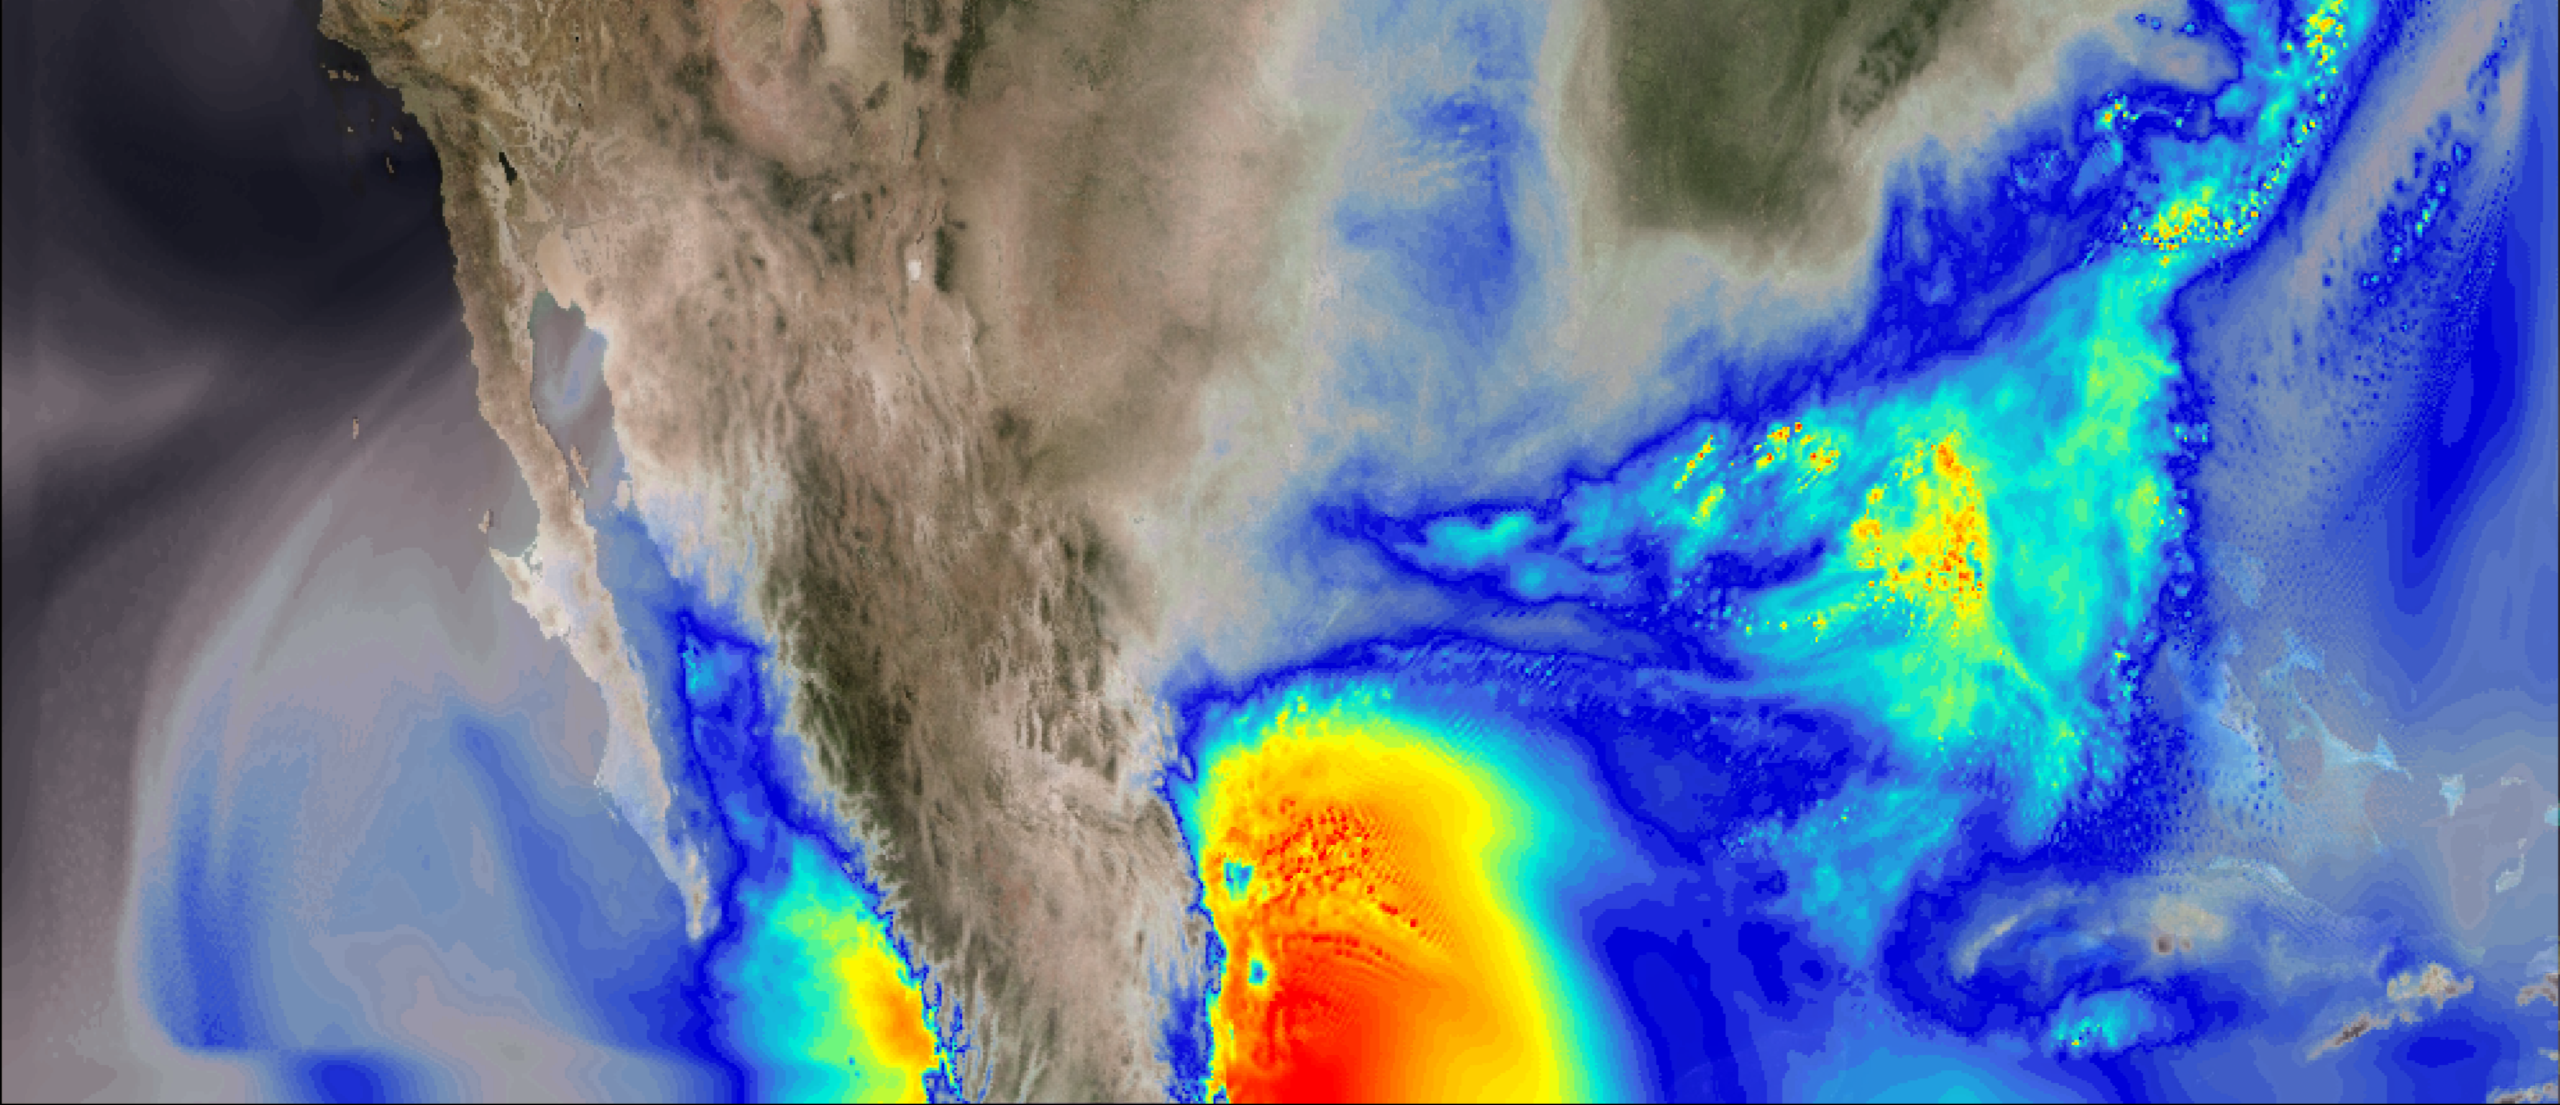
This visualization shows column integrated water vapor content over North America for the period April to June 2011, during which time one of the most destructive and deadliest tornado outbreaks to impact the United States occurred (April 25-28). Side-by-side comparison of the simulations show greater water vapor content in the simulated future climate, which can…
Read moreCategory: Atmosphere
F5 Tornado in CM1
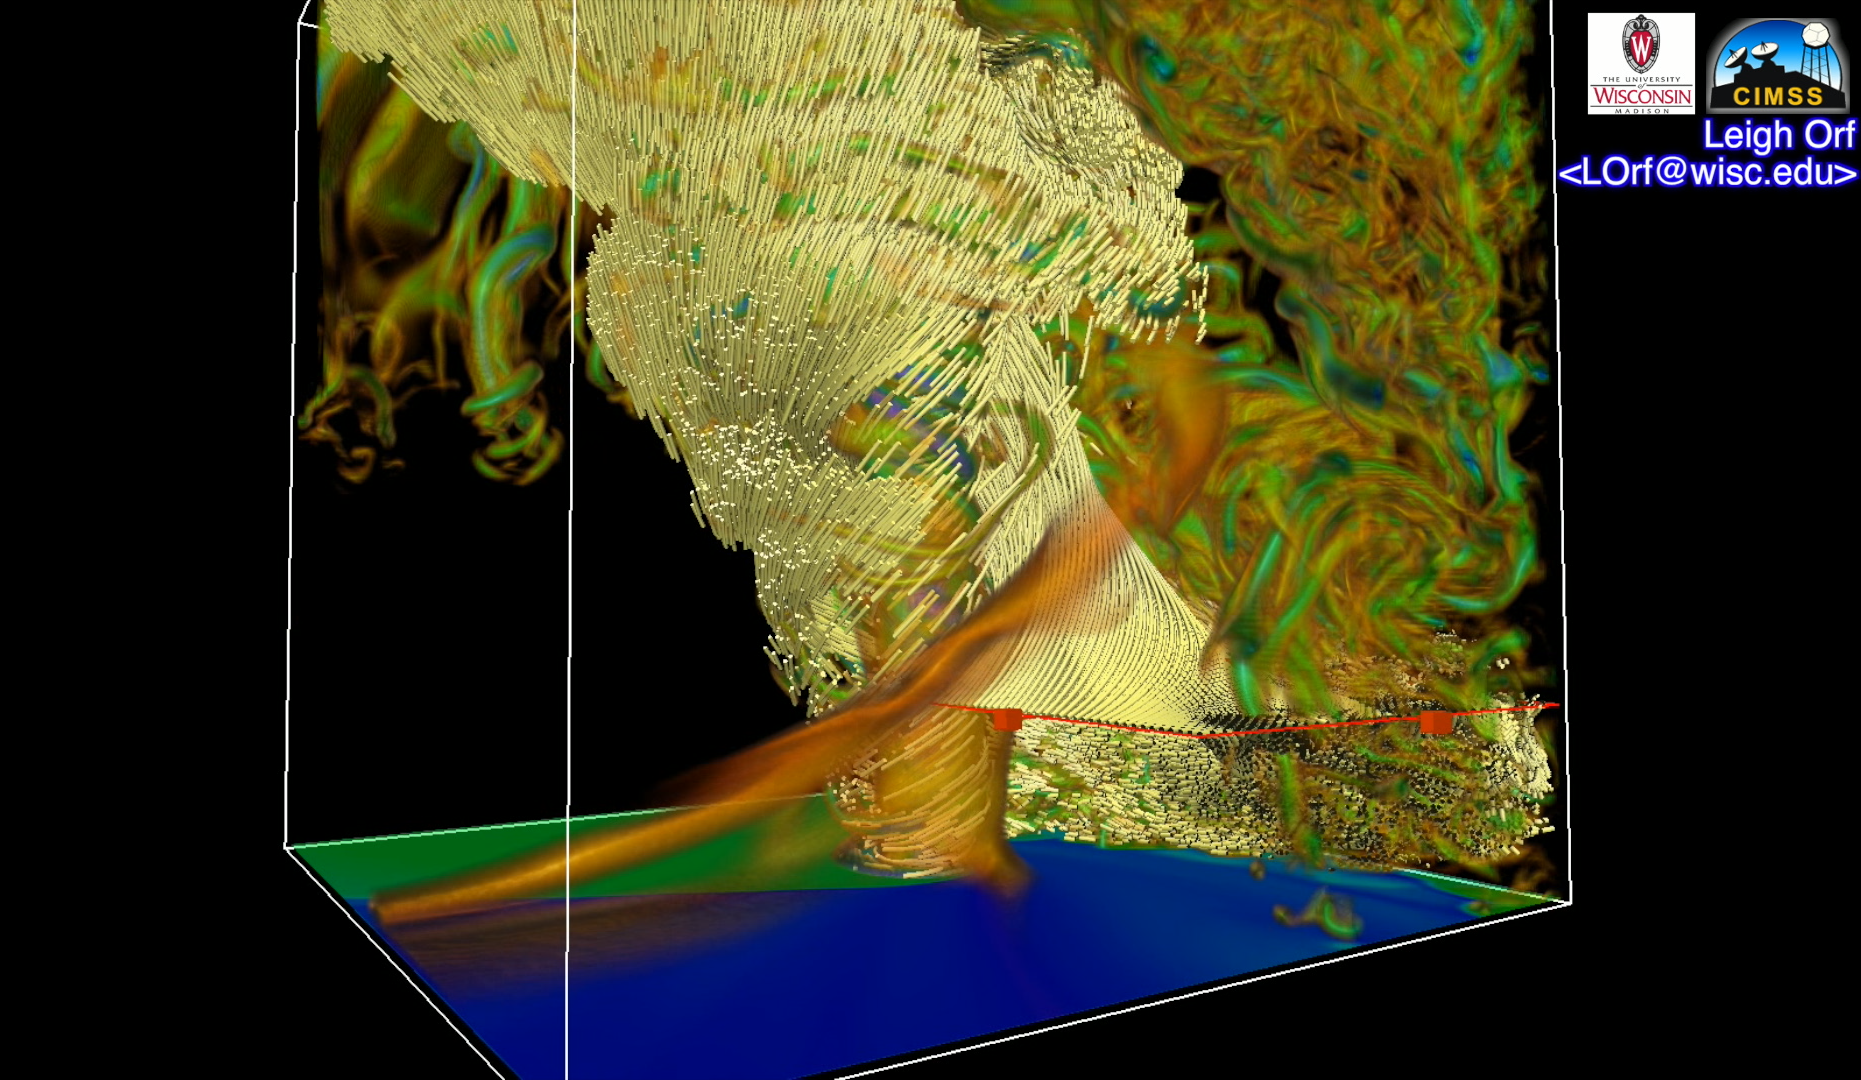
A simulation of an F5 tornado produced by Cloud Model 1 (CM1). Movies Quicktime Movie File (1920×1080, 2.57 GB) Images Science and Visualization Credits Leigh Orf, University of Wisconsin Madison. Model CM1. Visualization Software VAPOR
Read morePlanetary Boundary Layer Height
Planetary Boundary Layer (PBL) is the lowest part of the atmosphere which is directly influenced by the Earth’s surface. The top of the PBL often acts like a cap to trap air in the layers below thus having a major influence on atmospheric phenomenon like dispersion and concentration of pollutants (air quality), trade winds, cloud…
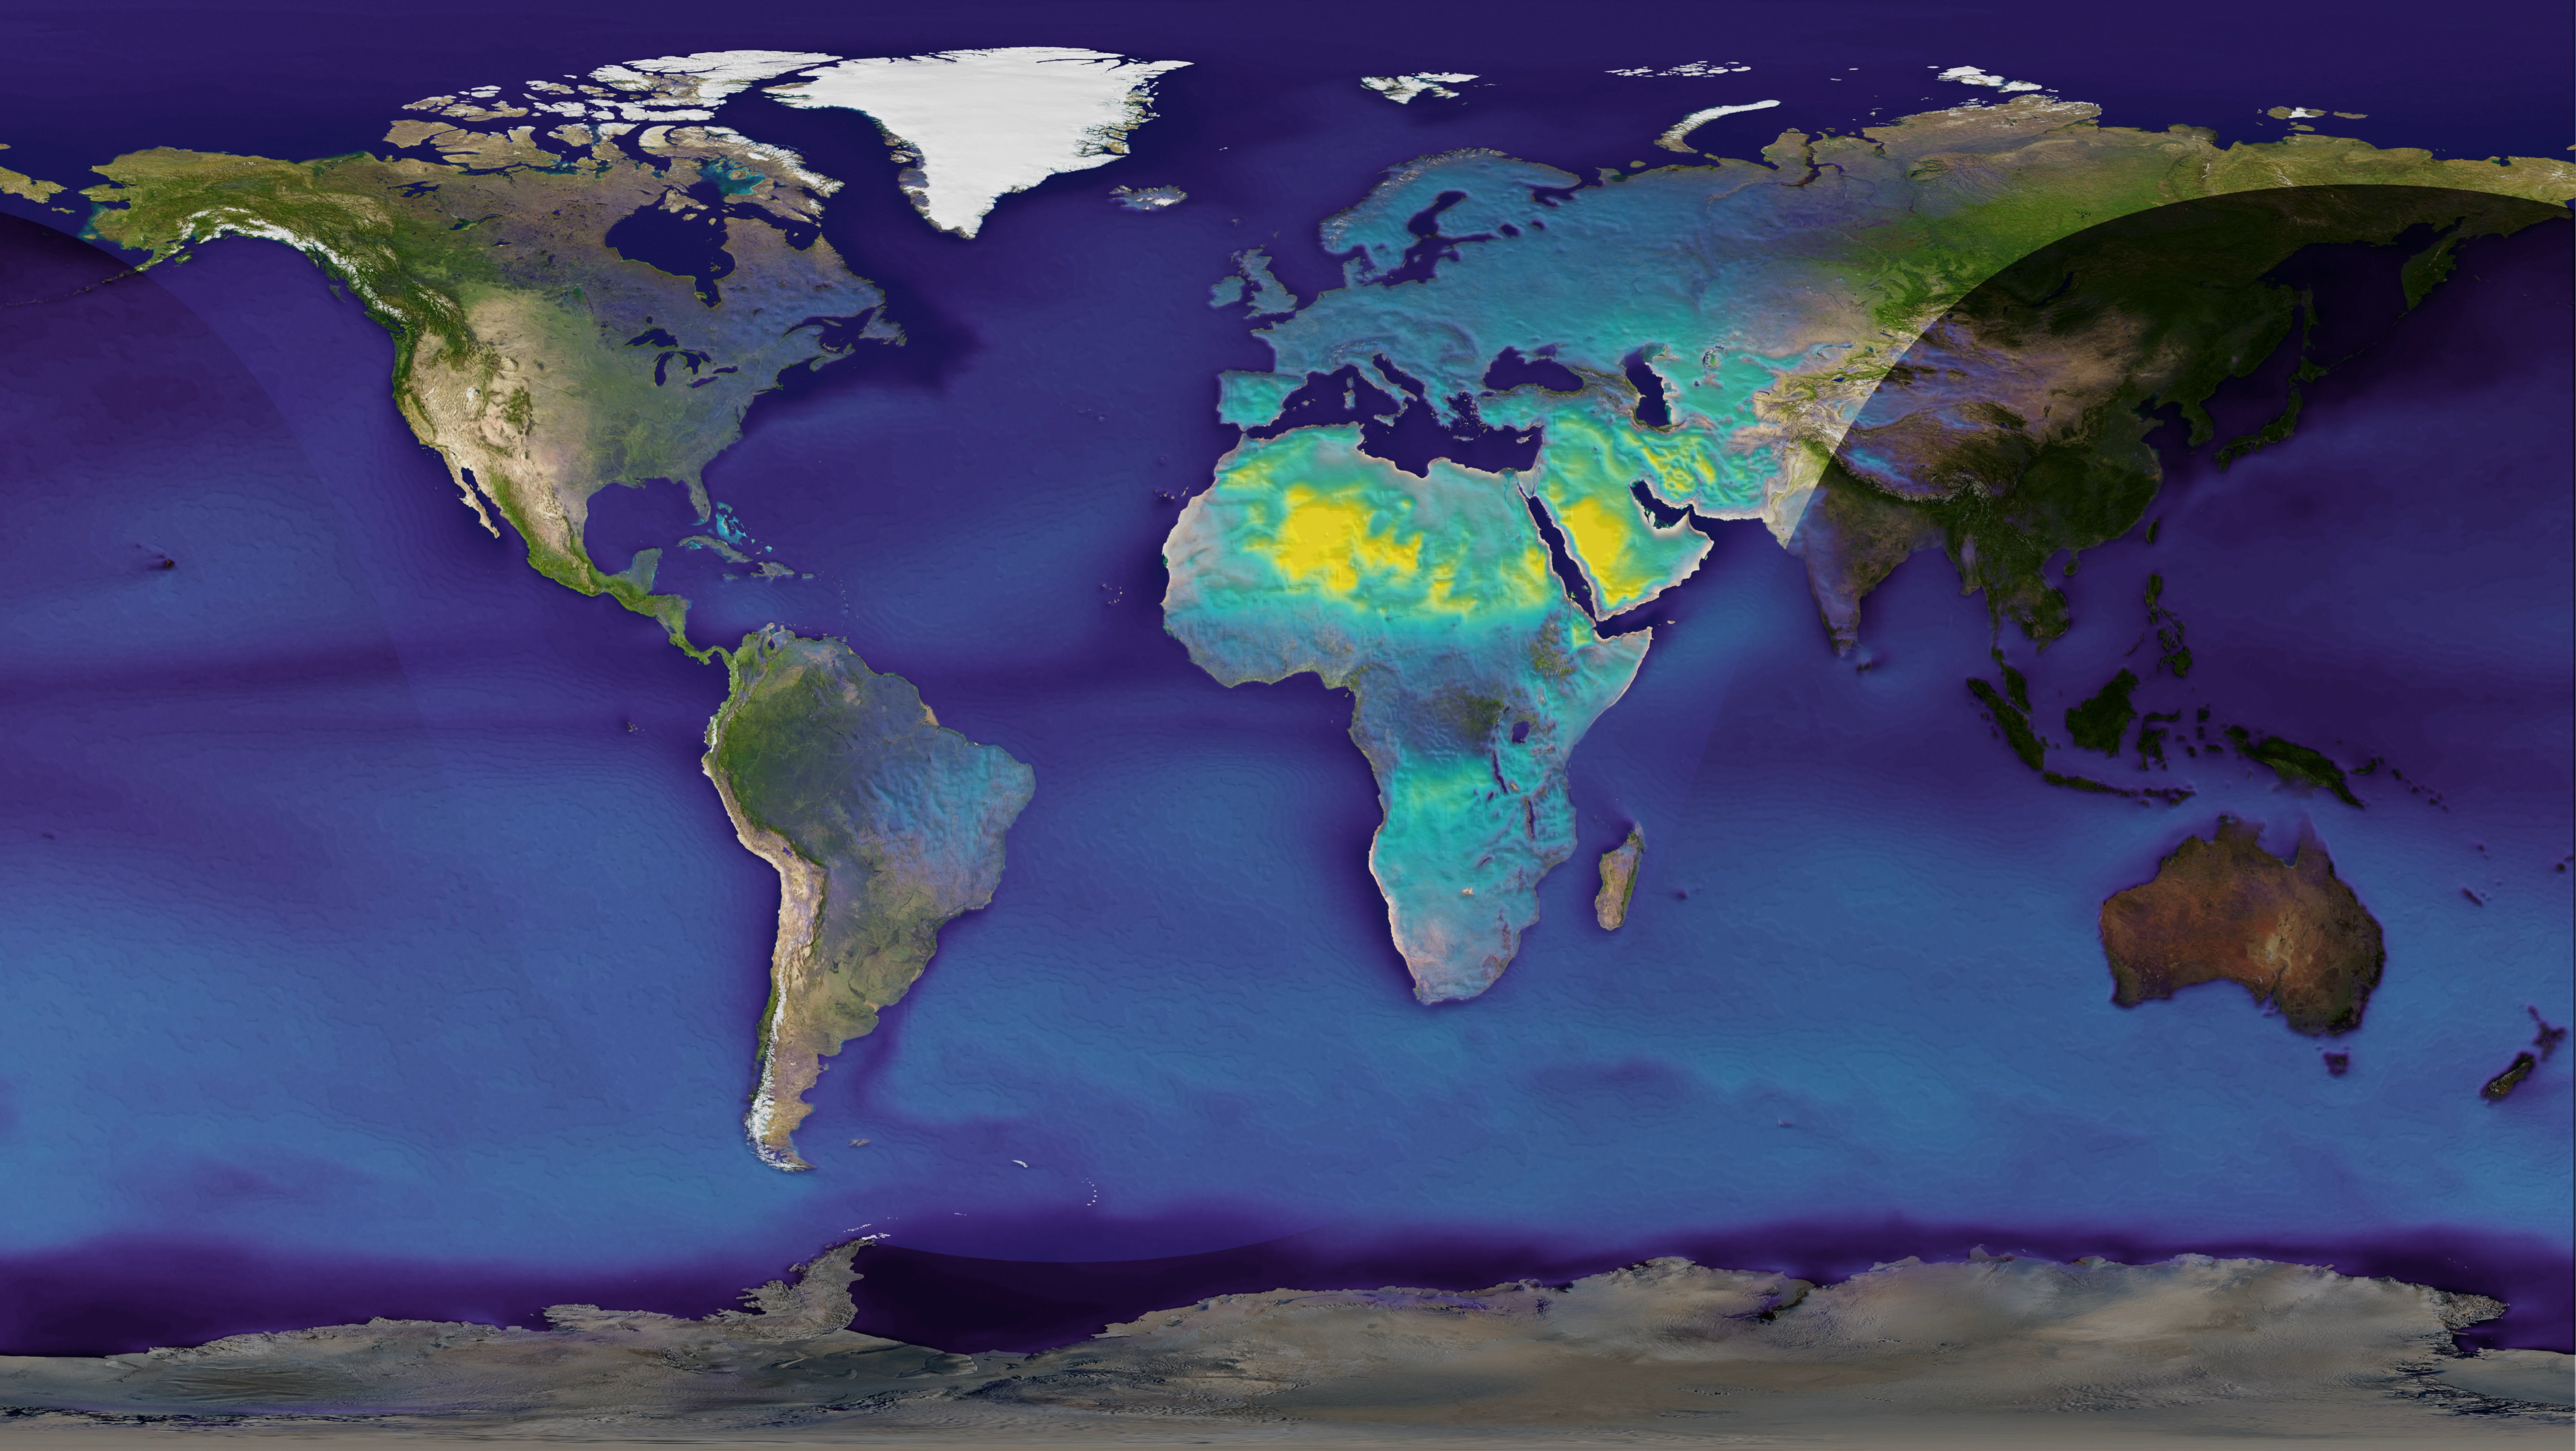
Read morePresent and Future Climate in a Global Model
This visualization shows a CESM1 model comparison between a present day (1990) and a future (2090) simulation using a business-as-usual or high emissions scenario, called RCP8.5. Clouds represent six-hourly time steps of total water vapor for one year. Technically speaking, this is the CESM1 model variable, TMQ, defined as the total precipitable water (vertically integrated)…
Read moreDroplet Dynamics in Cloud Turbulence

The study of droplet dynamics is a crucial part of cloud physics and involves investigation of each and every droplet’s properties. It is difficult to carry out such investigations using field observations. Small scale simulation is one method to study such phenomena, and visualization of these processes provides a deep and quick understanding. This work…
Read moreClimate Change: Precipitation
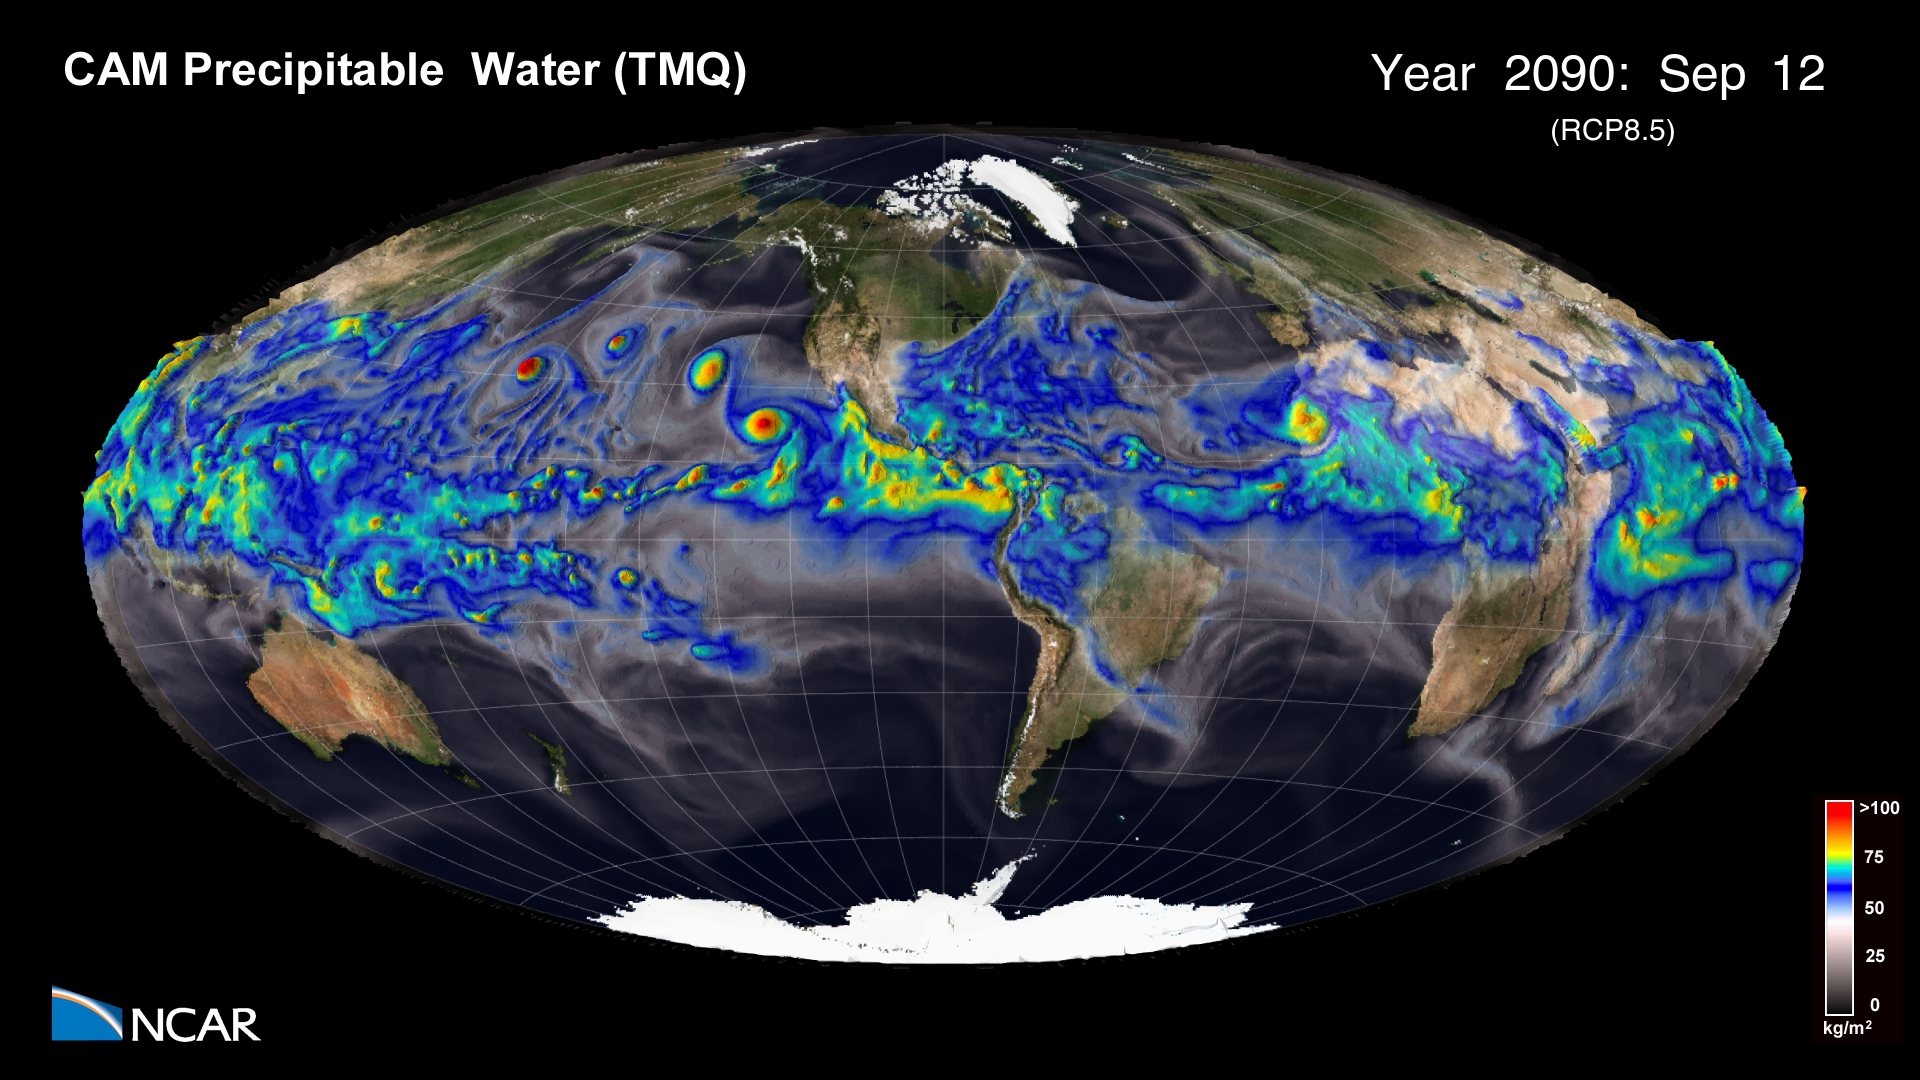
This simulation shows a comparison between present day (1990) and future (2090) precipitable water in the Earth’s atmosphere using an RCP8.5 emissions scenario. Movies Movie File (.mov, 1920×1080, 236MB) Images Science Credits This simulation was made possible because of the large number of individuals both from within NCAR and the many outside collaborators who have…
Read moreClimate Change: Temperature Anomalies
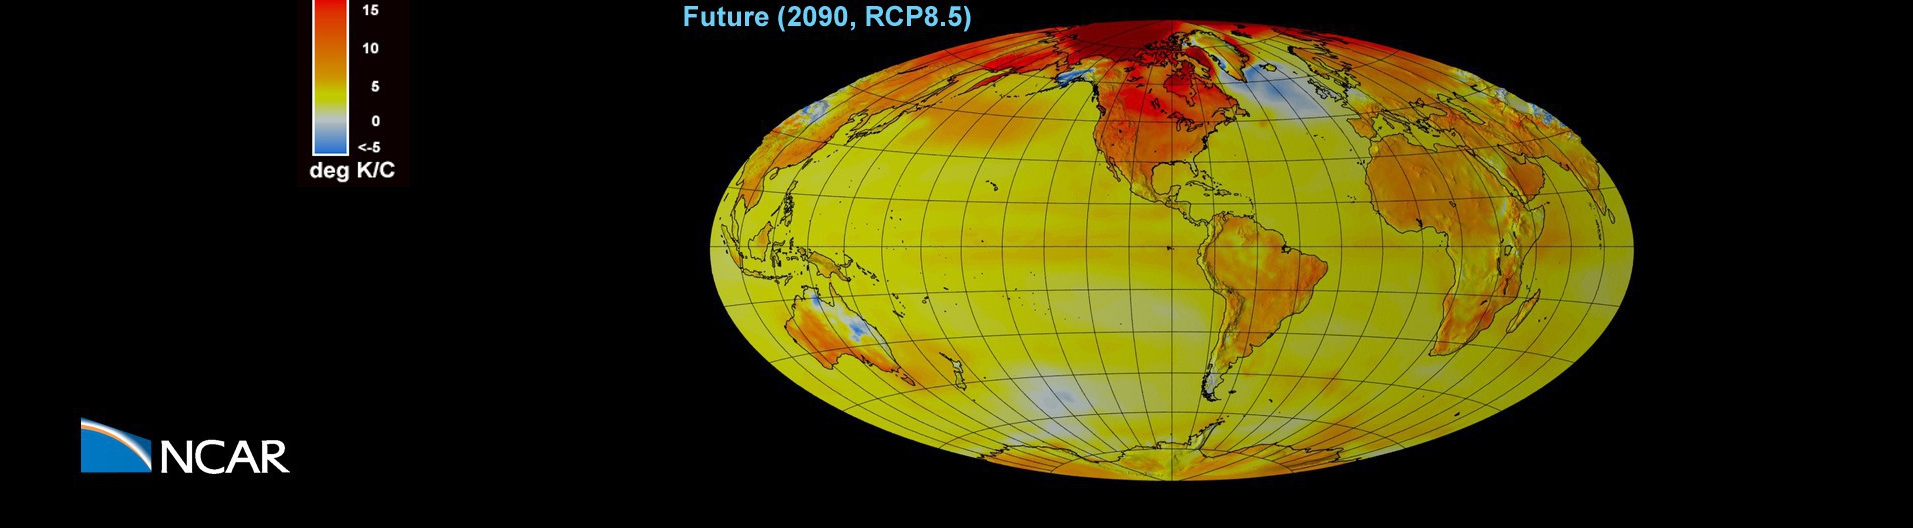
A comparison between present and future (RCP8.5) surface temperature anomalies. A 3-day smoothing has been applied to the output to dampen day to day variability. Movies Movie File (.mov, 118MB, 1920×1080) Images Computational Modeling Nan Rosenbloom and Gary Strand (NCAR/CGD) Visualization and Post-production Tim Scheitlin and Matt Rehme (NCAR/CISL) Model CESM Visualization Software NCAR Command…
Read moreNegative NAO Triggered by Stratospheric Sudden Warming
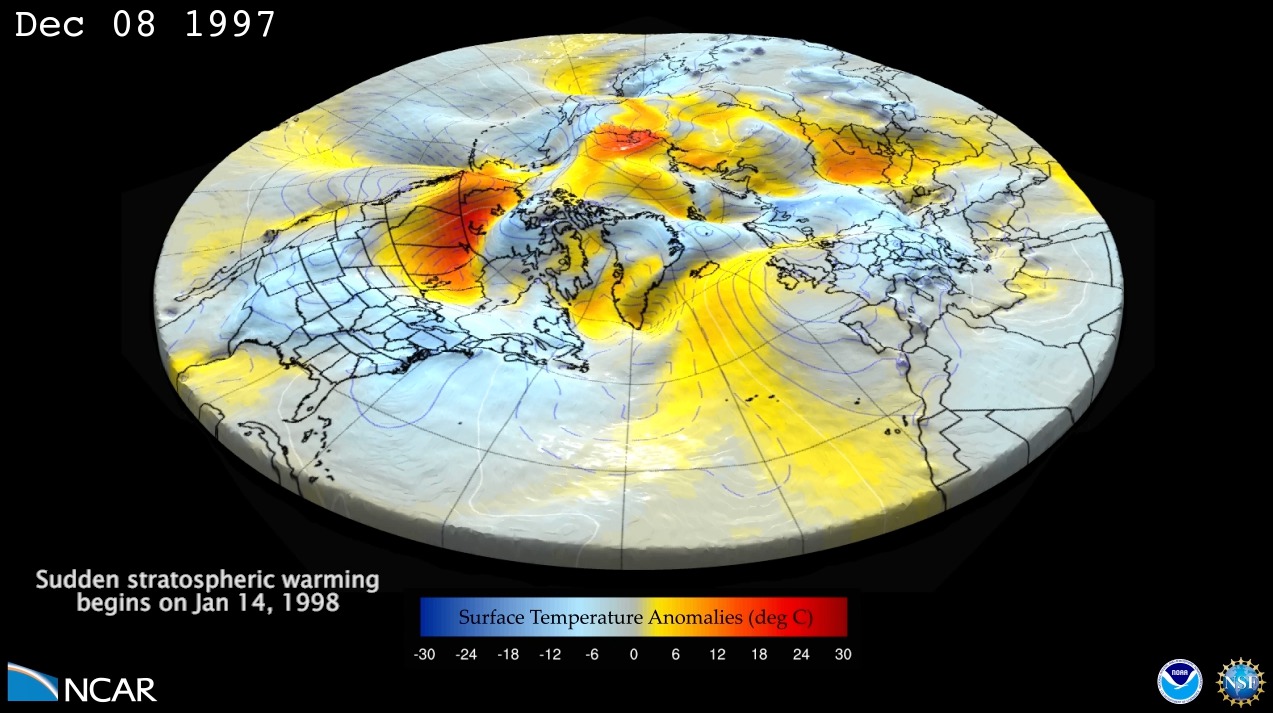
Seasonal forecast for winter of 1997/1998 with 46LCAM (Ensemble member with a sudden stratospheric warming). This is a 4 month forecast of surface geopotential height anomalies (shown with surface relief and contour lines) and surface temperature anomalies (shown with a color gradient). The forecast starts on Dec 1, 1997, and goes through the end of…
Read moreGlobal weather simulated by a cloud-resolving weather prediction model
The global weather from 20 October – 4 November 2012, simulated by a cloud-resolving weather prediction model Model: MPAS – Variable: Outgoing Longwave Radiation Science: The complex evolution of multiscale cloud systems illustrates the myriad of weather phenomena that populate our atmosphere. Features of interest include the diurnal cycle of convection over central Africa and…
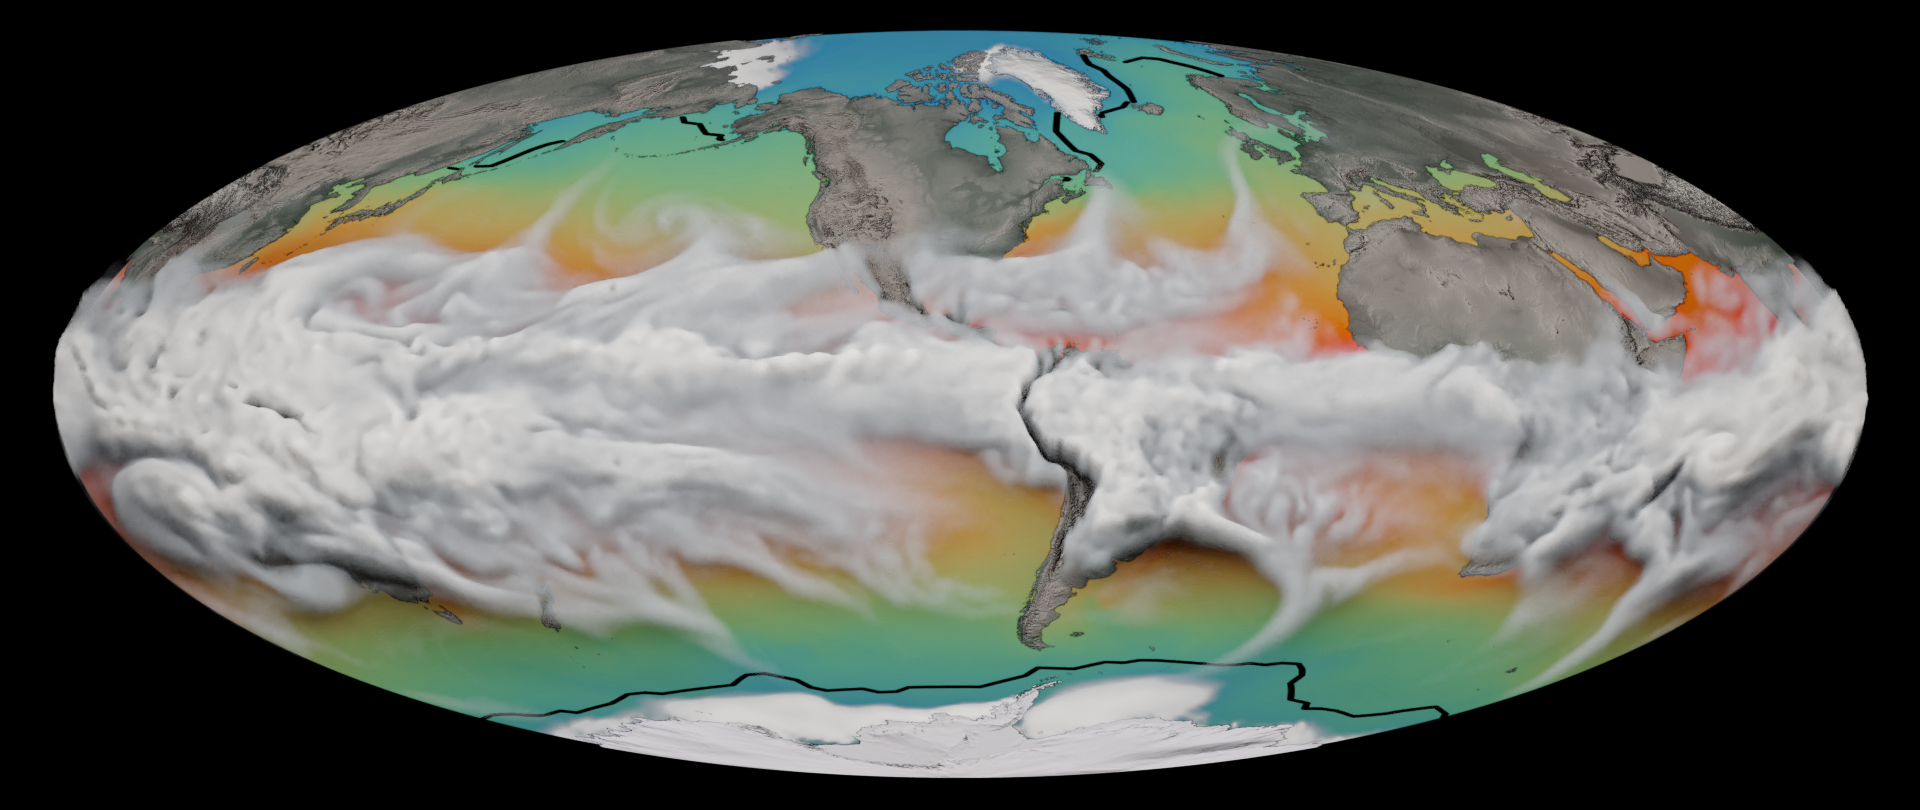
Read moreOcean impact on atmospheric oxygen and carbon dioxide
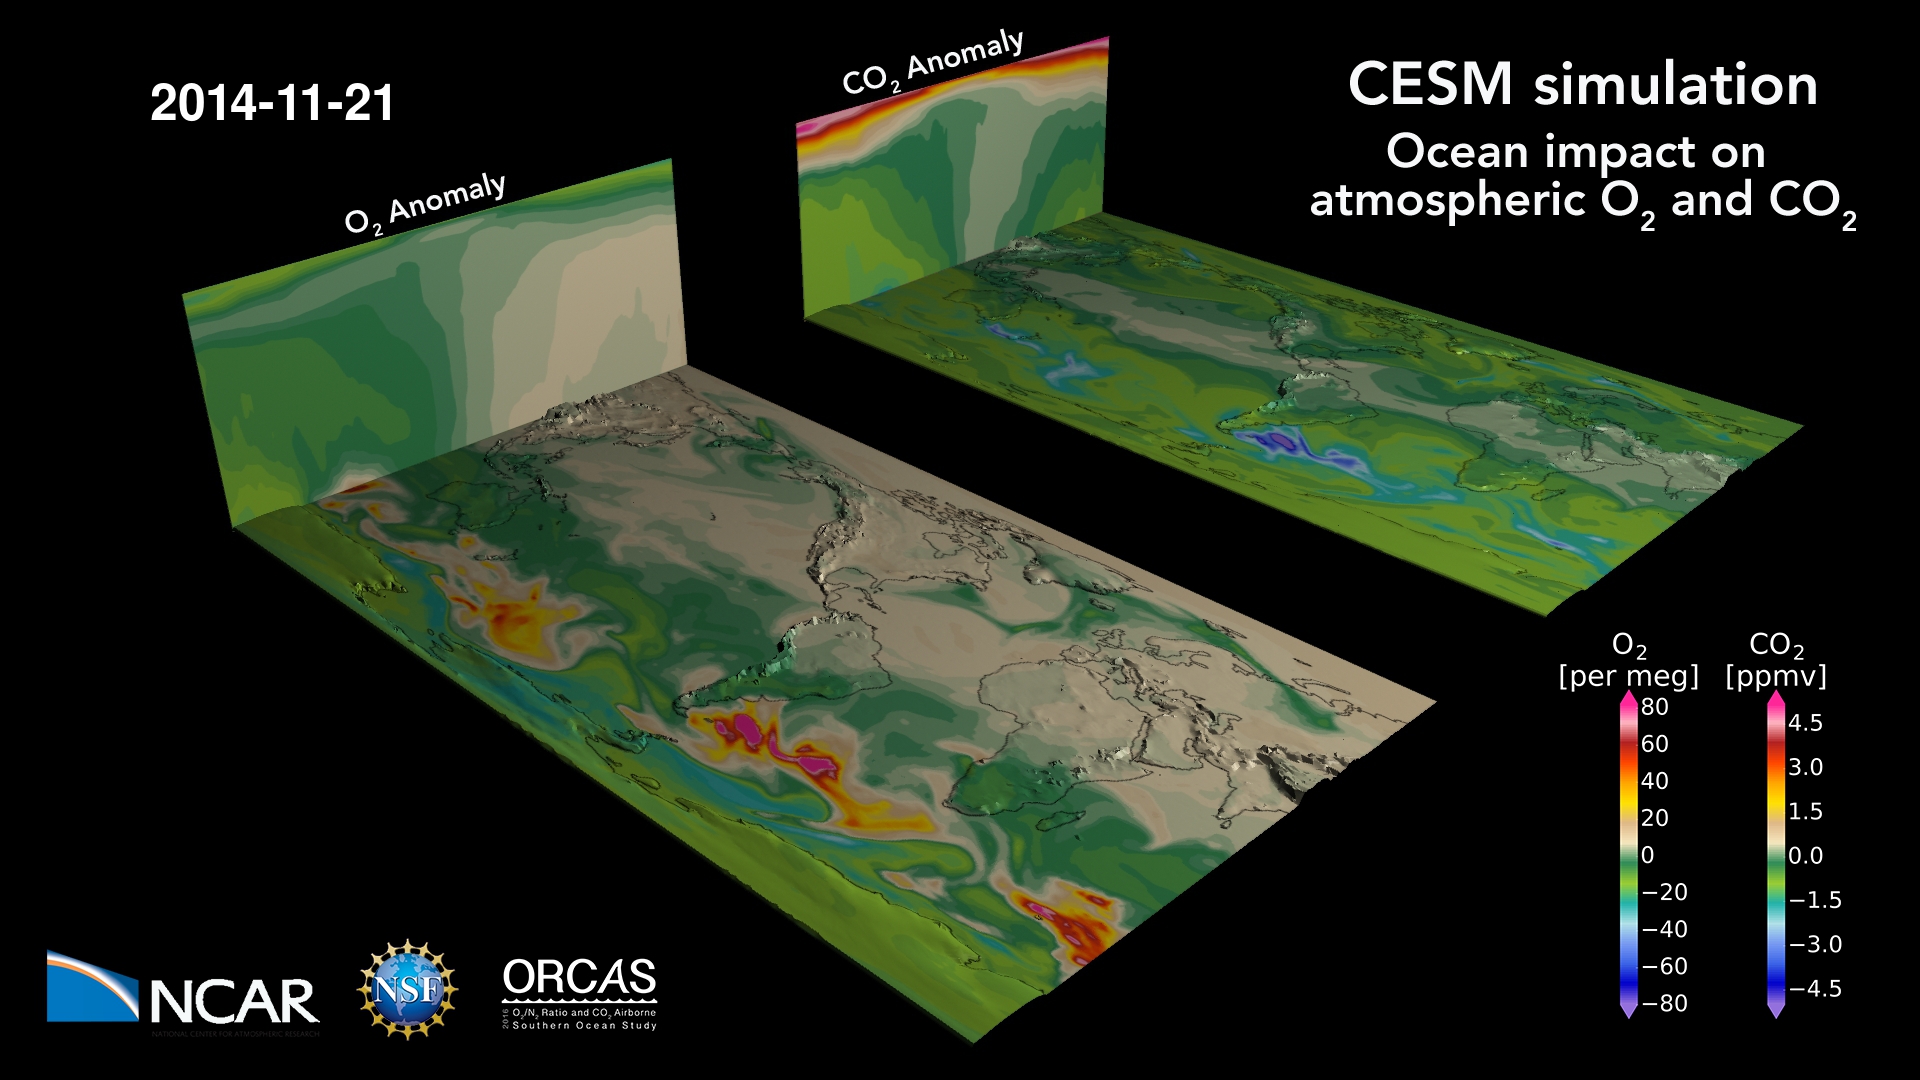
The ocean breathes: a map of oxygen and carbon dioxide variations in the atmosphere due to air-sea gas exchange, stirred by winds. The ocean absorbs CO2 and releases O2 in the summer hemisphere, primarily due to photosynthesis (and warming, for O2) at the surface; the reverse happens during winter when the surface cools and deep…
Read more