
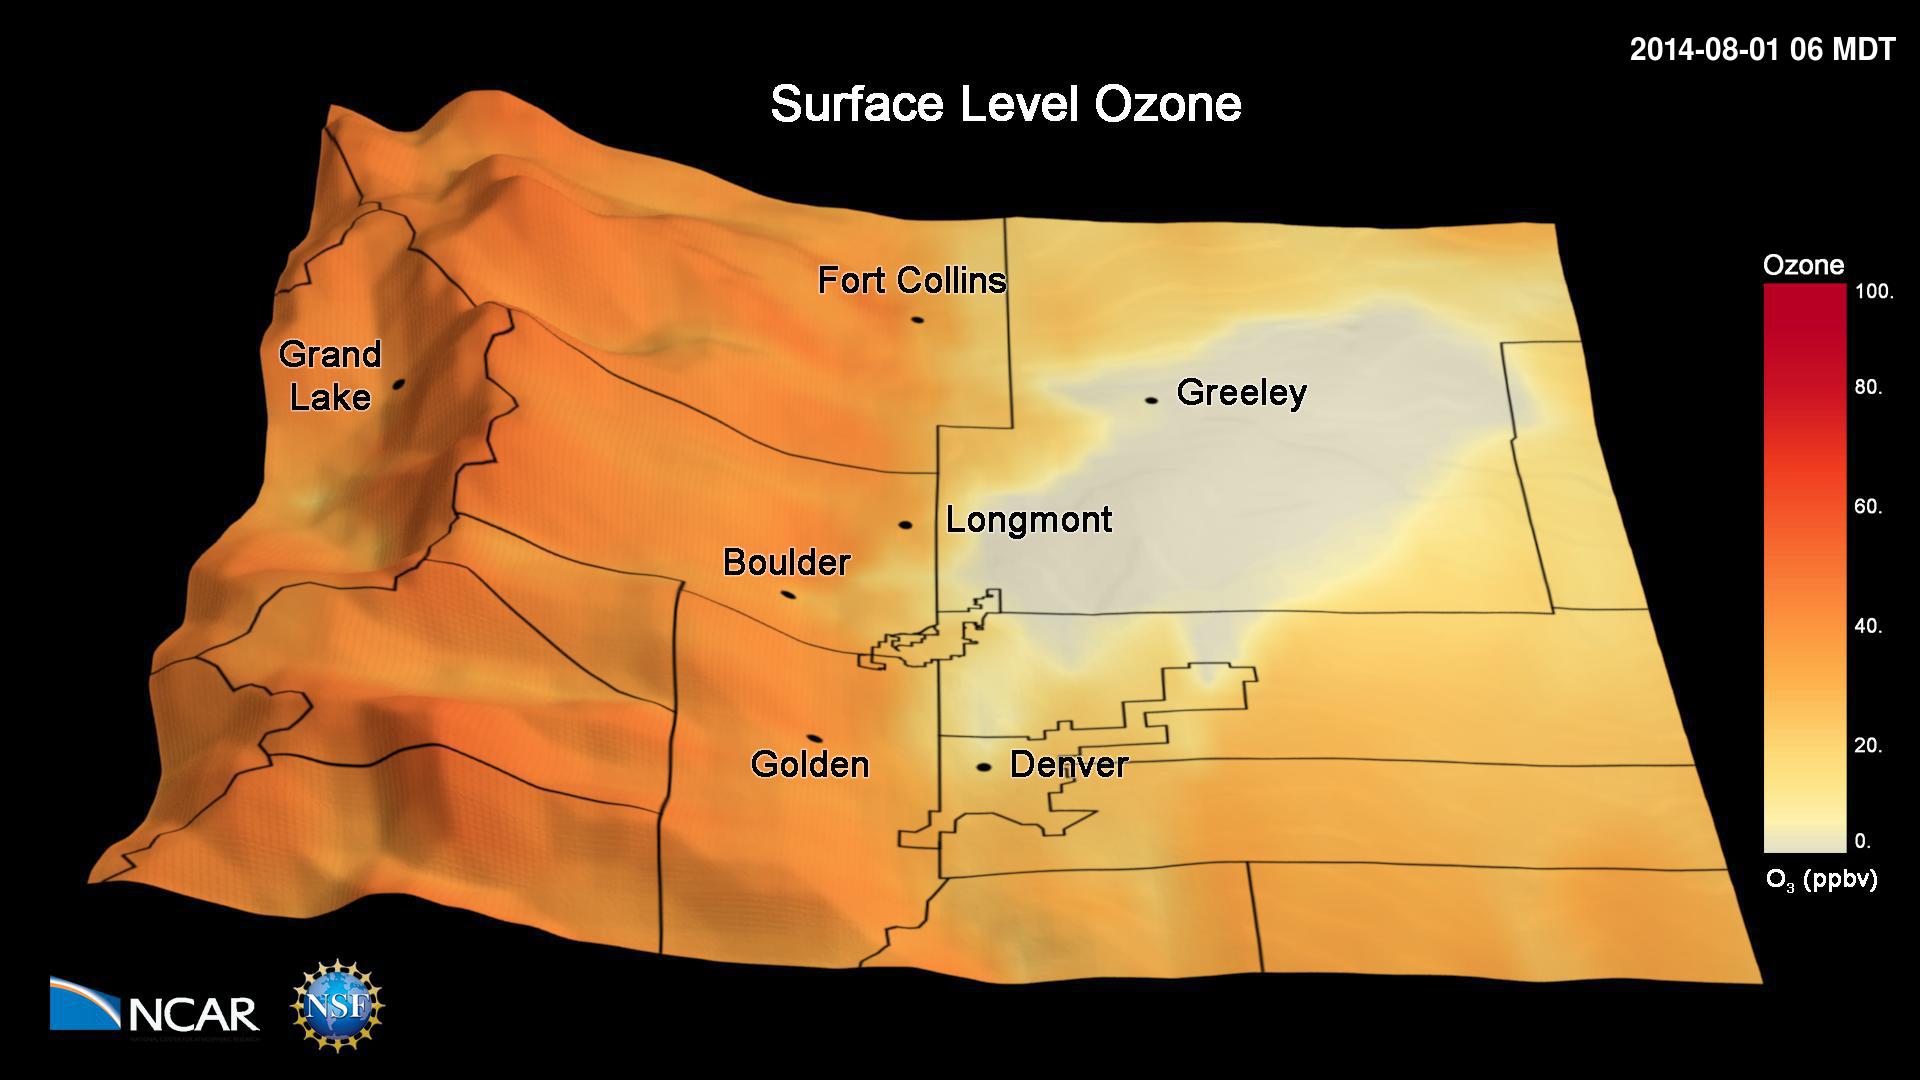
This animation shows simulated hourly surface ozone concentrations during the 2014 FRAPPÉ campaign. The simulations have been performed with the Weather Research and Forecasting (WRF) Community Multiscale Air Quality (CMAQ) model. The simulations have been conducted with a 4 km x 4 km grid horizontal resolution and show the frequent occurrence of high ozone pollution…
Read moreCategory: Atmosphere
Total Accumulation of Global Precipitation
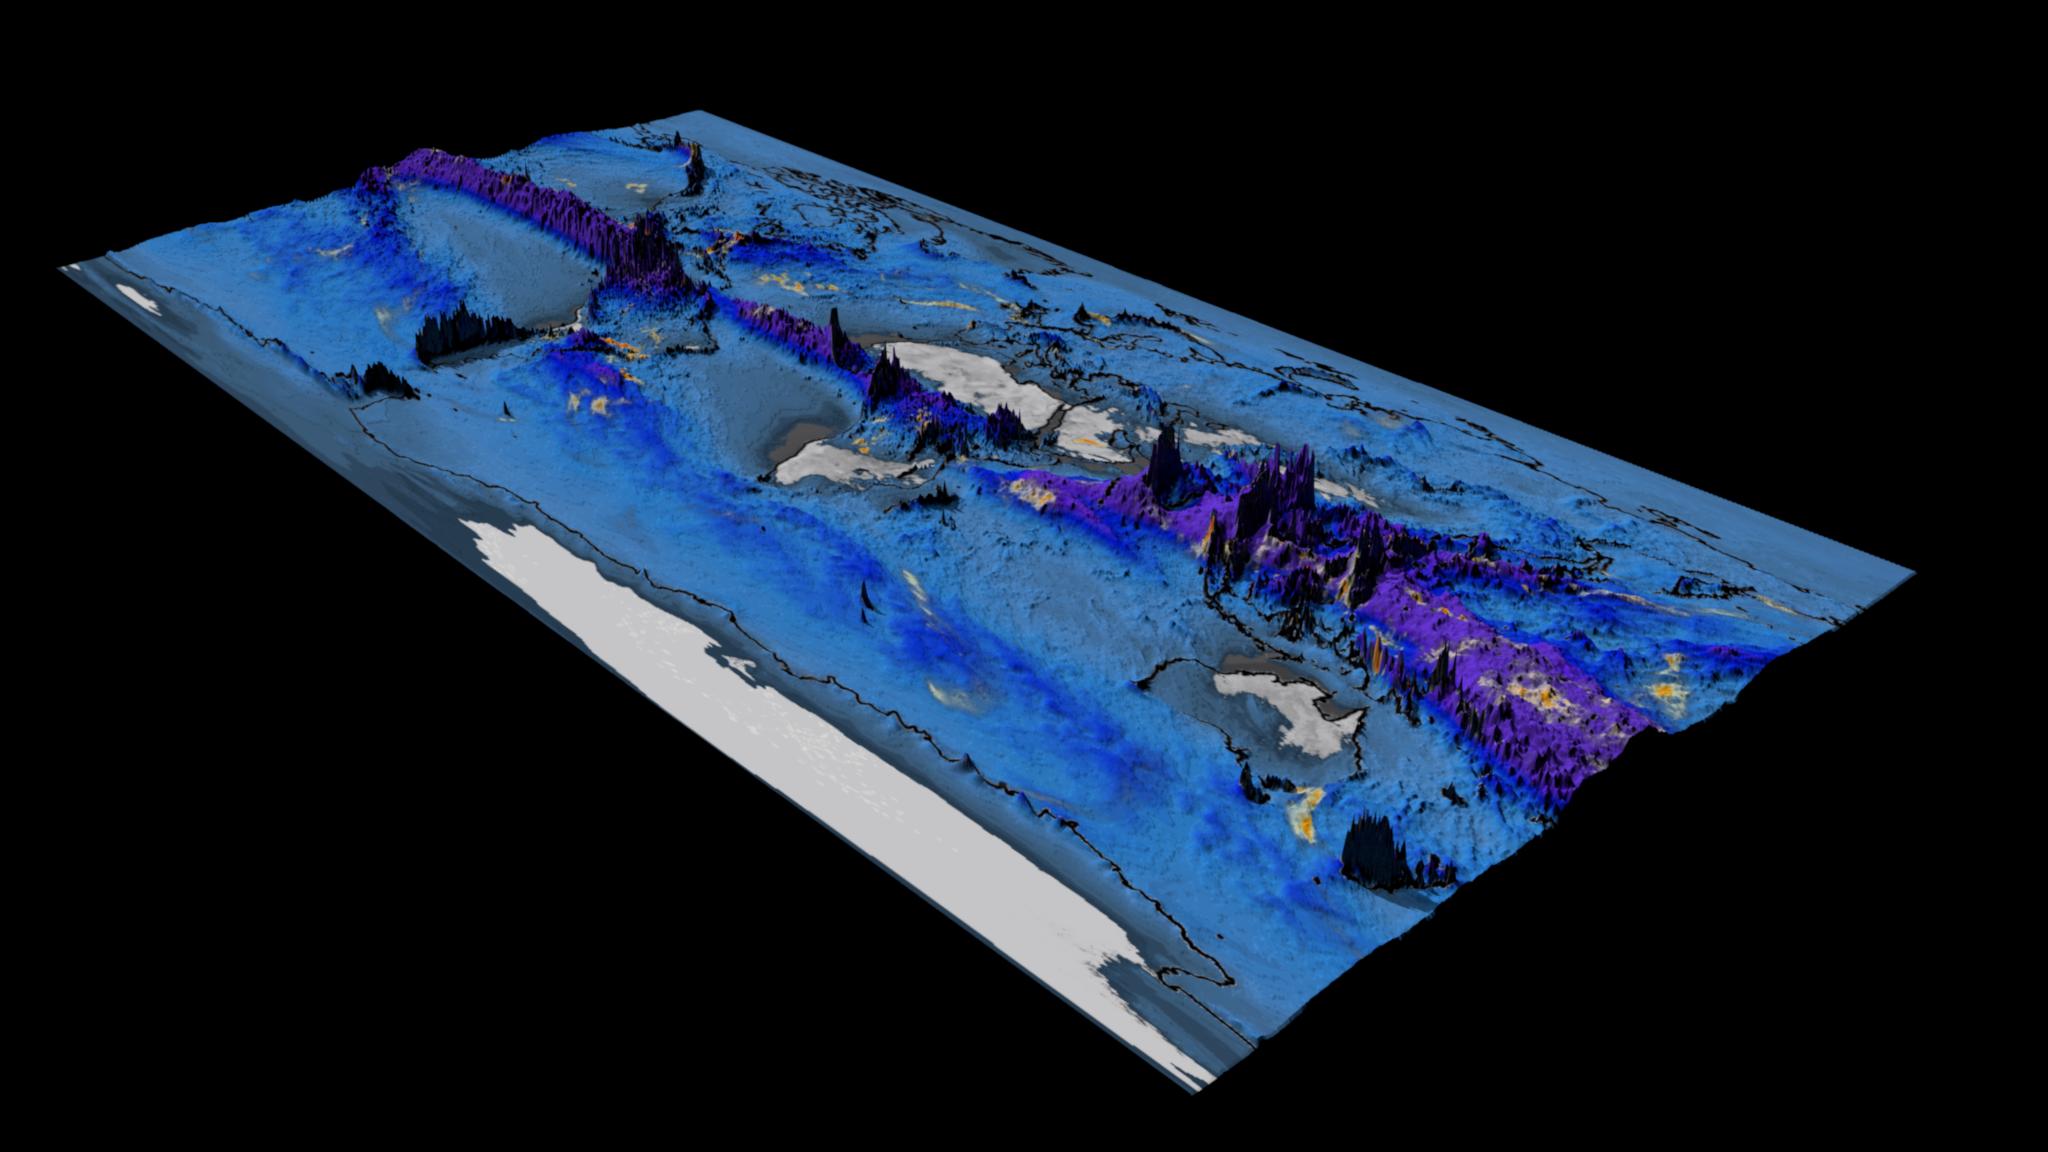
Project Metis: Seasonal Forecasts with Enhanced Ocean and Atmosphere Resolution This visualization shows total accumulation of global precipitation (blue/purple) and the 6-hourly precipitation (yellow/red) between May 1 and Nov 1, 2015. What to look for: Of particular interest are the cyclones that scrawl lines across the map, leaving a visible trail in the total precipitation field. Movies Movie…
Read moreVariable Resolution Regional Climate Simulations with CESM
This visualization shows the output from a Variable Resolution Regional Climate Simulations with CESM (Community Earth System Model). Movies Movie File (.mp4, 319MB, 1920×1080) Images Computational Modeling Colin Zarzycki, Andrew Gettelman, Peter Lauritzen and Patrick Callaghan (NCAR/CGD) Visualization and Post-production John Clyne and Matt Rehme (NCAR/CISL) Model Variable Resolution Regional Climate Simulations with CESM (Community…
Read moreSurface Temperatures from Climate Change vs. Geoengineering
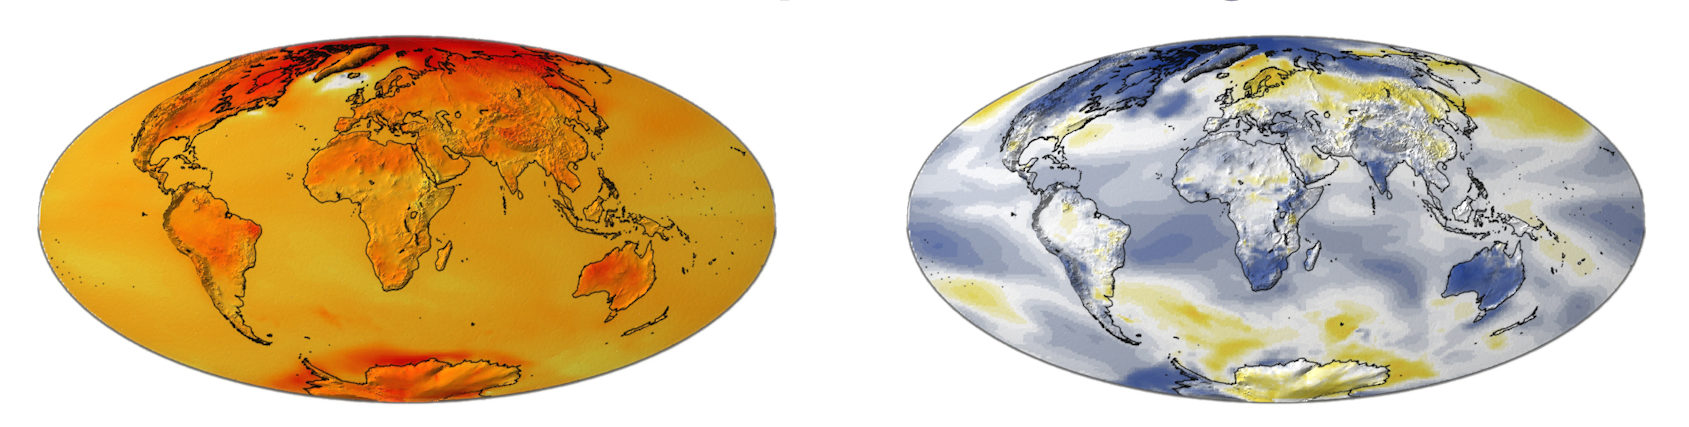
This visualization describes temperature changes relative to years 2015-2024 from unabated climate change (RCP8.5) and stratospheric sulfate aerosol geoengineering (using feedback) simulated by a state-of-the-art coupled earth system model. Geoengineering, often using stratospheric sulfate aerosols, is discussed as a potential means of deliberately offsetting some of the effects of climate change, such as rising temperatures.…
Read moreDeep Water Impact Ensemble Data Set
The Deep Water Impact Ensemble Data Set was generated from large simulations of asteroids crashing into the ocean. These simulations were run using various sizes of asteroids and angles of entry in order to study the aftermath of the impacts. The data set was the subject matter for the 2018 IEEE VIS SciVis Contest, held…
Read moreWind Speed
This visualization shows the magnitude of the wind speed over the course of one year from atmosphere-only simulations of the high resolution (horizontal 1/4 degree) Community Earth System Model simulating the present day climate. Movies Movie File (.mp4, 1920×1080, 588MB) Images Science Credits Susan Bates and Nan Rosenbloom Computational Resources This research used resources…
Read morePlanetary Water Vapor
This visualization shows hourly time steps of CESM1 total column integrated water vapor (TMQ) for one year. The value of TMQ at each point determines the amount of 3D surface displacement. Higher values of TMQ have a larger displacement, helping to visually identify regions with the most significant temporal changes in water vapor. Movies Quicktime…
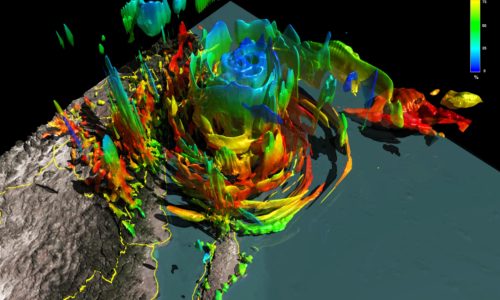
Read moreWind Turbine Performance
Wind Turbine Simulation And Its Animation: Computational Study of Wind Turbine Performance And Loading Response to Turbulent Atmospheric Inflow Conditions Movies Movie File (1920×1080, MP4, 362MB) Images Developers: University of Wyoming: Dimitri Mavriplis Michael Stoellinger Michael Brazell Andrew Kirby Zhi Yang Parallel Geometric Algorithms, LLC.: Jay Sitaraman Visualization and Meshing Support: Intelligent Light: Earl Duque…
Read moreNCAR’s Wind Forecast Improvement Project 2
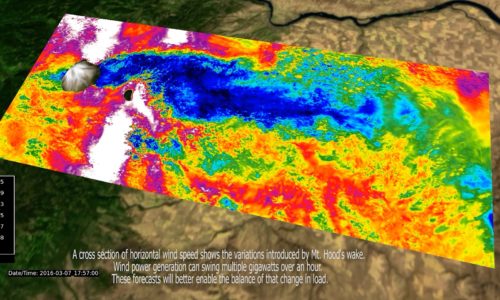
By the end of 2016, the state of Oregon had an installed wind generating power capacity of over 3 Gigawatts. Wind power, while clean and renewable, requires constant load balancing due to variable weather conditions. These conditions must be met with state of the art forecasting methods in order to maximize load balancing efficiency. New…
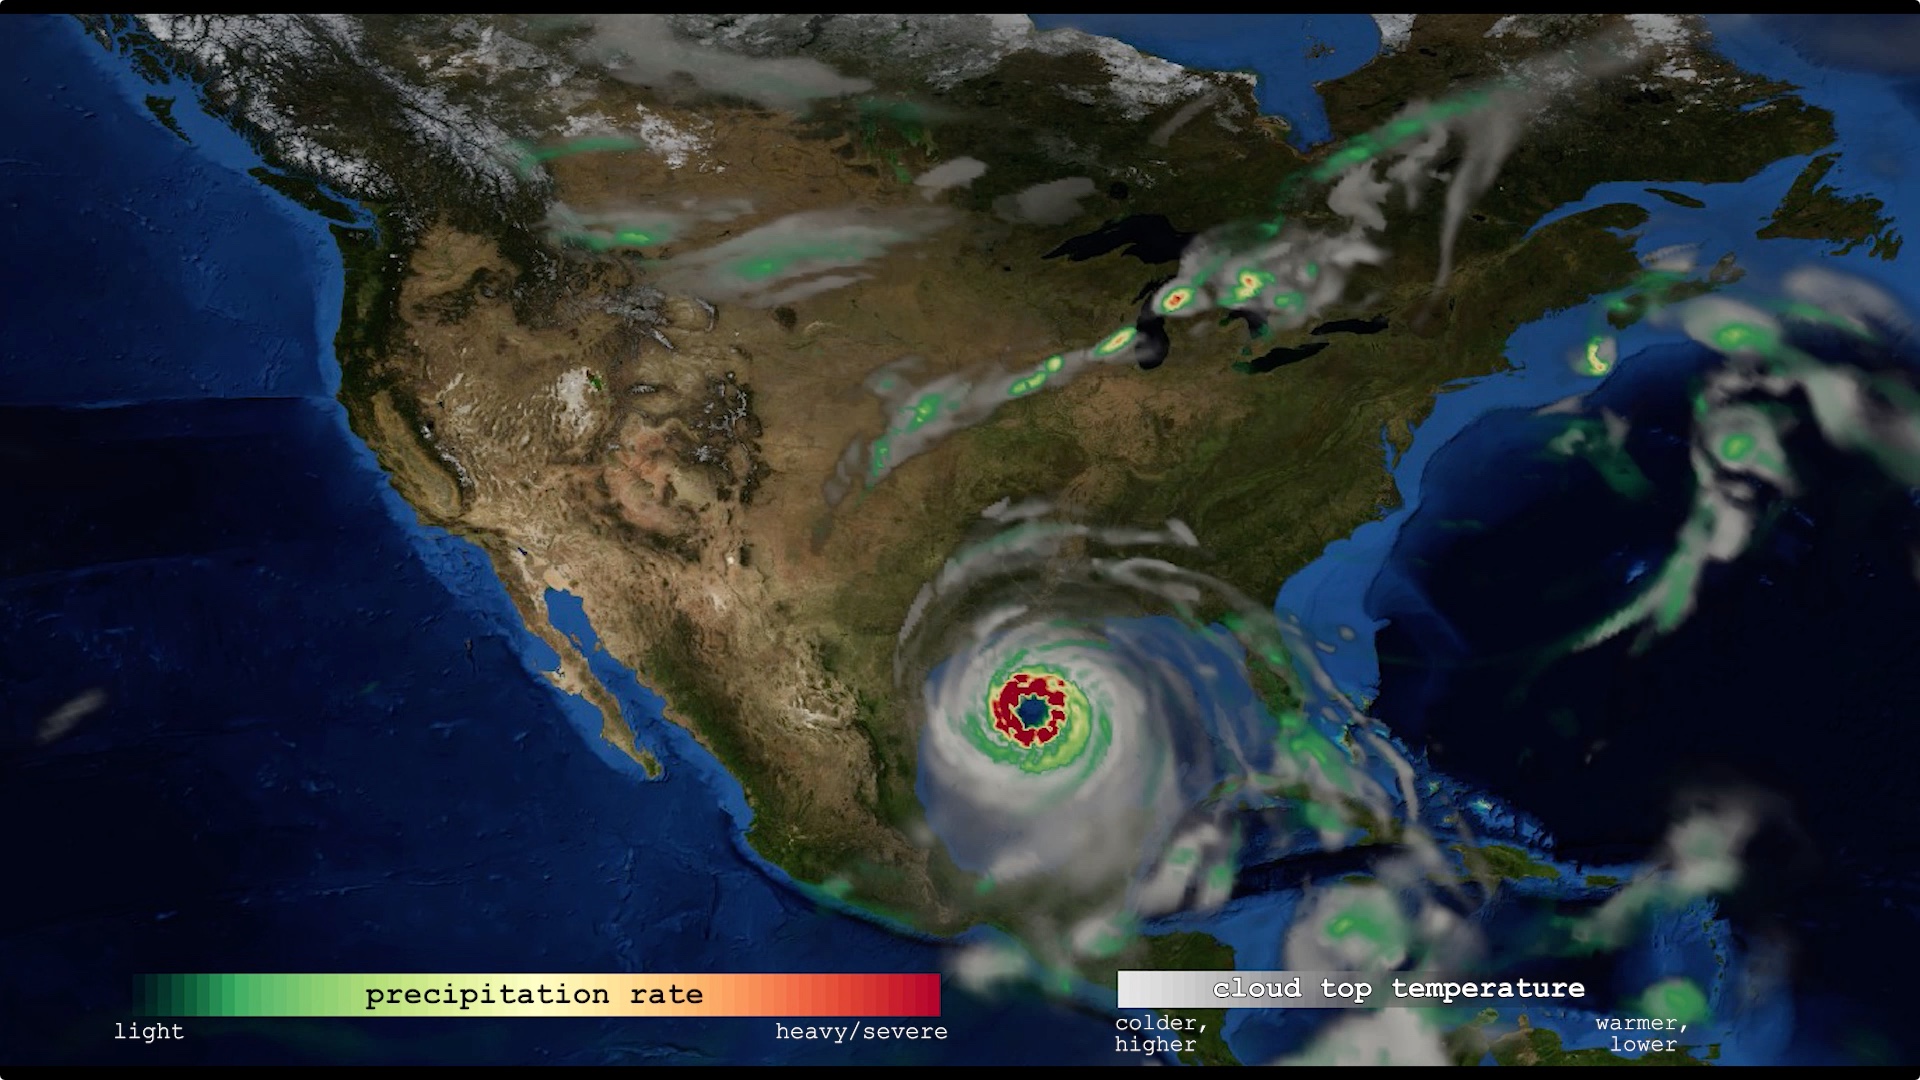
Read moreHurricane Odile
Hurricane Odile swept across the Baja California Peninsula in September 2014 leaving behind widespread damage, flooding, and power outages. It reached category 4 intensity before weakening as it tracked across the length of the peninsula. This visualization is a 15-minute Hurricane Weather Research Forecast (HWRF) simulation (1251x1251x61) of Hurricane Odile shortly after it made landfall.…
Read more